图表作文写作技巧指引
一、 图表类型
二、 要点分析
A. 表格图
1横向比较: 介绍横向各个数据的区别,变化和趋势
2纵向比较:介绍横向各个数据的区别,变化和趋势
3无需将每一个数据分别说明,突出强调数据最大值和最小值,对比时要总结出数据对比最悬殊的和最小的
说明:考察例举数字的能力和方法。注意怎样通过举一些有代表性的数据来有效地说明问题。
B. 曲线图
1极点说明: 对图表当中最高的,最低的点要单独进行说明
2趋势说明: 对图表当中曲线的连续变化进行说明,如上升,下降,波动,持平
3交点说明: 对图表当中多根曲线的交点进行对比说明
说明:关键是把握好曲线的走向和趋势,学会general classification,即在第二段的开头部分对整个曲线进行一个阶段式的总分类,使写作层次清晰。接下来在分类描述每个阶段的specific trend,同时导入数据作为你分类的依据。注意不要不做任何说明就机械性的导入数据!可以使用一些比较native的单词和短语来描述trend。
C. 饼状图
1介绍各扇面及总体的关系
2各个扇面之间的比较,同类扇面在不同时间,不同地点的比较
3重点突出特点最明显的扇面:最大的,最小的,互相成倍的
D. 柱状图
1.比较: similarity
2.对比: difference)
3.横向总结所有柱状图表的共性特征 & 分别描写各个柱子的个性特征
E. 流程图
1. 首先说明:做什么工作的过程,目的是什么
2. 准备工作
3. 按时间/过程先后描述
4. 结果
5. 简单总结(可有可无)
说明:注意流程图里的“因果关系”或每一流程的“承前启后”关系;表达每一流程的主体内容,阐明这种关系;揭示其内在联系或规律;最后,给予简要归纳和总结。
F. 实物/器具工作过程
1. 实物的名称,功能
2. 基本结构
3. 工作过程
4. 简单总结
G. 综合图
1不求甚解,不拘泥于细节
2分门别类,分段落详细介绍各个图表
3不画蛇添足,主观臆断或猜测图表之间的关系
三、 框架结构
1.开头:该图阐述的是______的______.共有以下几个部分组成。
shows (that) / According to / As (is) shown in … / As can be seen from /
It can be seen from / We can see from / It is clear / apparent from the figures/statistics / It is from / This … tells us the main story about / concerning / concerned with / on / related to…
2.分析:首先看到的是____, 在_____年呈现出____的趋势 / 占______; 其次,……第三[比
较分析]
1)内容:figure、statistic、number、percentage、proportion
2)用语:
修饰语:
3.小结:由上图分析,可以看出/得出______.
在运动范畴中存在着如下的8种运动趋向:
1. 保持平稳:
可以使用的套用结构有: stay stable / remain steady
举例:表示“人口数量保持平稳”的时候可以写: the number of population stayed stable / the number of population remained steady
2. 上升/增加:
可以使用的套用结构有:rise / climb / increase / ascend /mount / aggrandize (增加)
举例:人口数上升:the number of population increased/ascended/mounted等等。
3.下降/减少:
可以使用的套用结构有:fall/ drop/ decrease/ descend/ decline
举例:人口减少:the number of population decreased/ declined
4. 下降后保持平稳:
这个图形比较奇怪,划出的线段应该前面是向下的,后面是平的,在表示这个平的时候我们就不可以使用 remain steady 了,我们要使用的结构是bottom out。
举例:人口下降后保持平稳:the number of population decreased and bottomed out
5.上升后保持平稳:
前面的上升我们就不用说了,但是在上升以后保持平稳,我们需要使用 level off。
举例:人口上升后保持平稳:the number of population mounted and leveled off
6.复苏:
前面下降了以后,然后就上升了,这两条线段的连接点就叫复苏。英语中表达为recover。
举例:人口下降后复苏:the number of population decreased and recovered
7. 波动:
这个就像我们的心电图一样。英语中叫 fluctuate。
举例:人口波动:
the number of population fluctuated.
8. 达到顶峰:peak / reach its summit / reach its zenith
举例:人口到达了顶峰:the number of population peaked/ reached its summit/ reached its zenith.
上面就是运动性线段的八种趋势了。但是上升,下降,波动是存在程度的。所以我们接下来要讨论的是程度的描述方法。程度只有两种,缓慢和陡然。
缓慢的/轻微的:
gradually/ smoothly/ steadily/ slightly
陡然的/大幅度的:
dramatically/ sharply/ considerably/ appreciably/ greatl
举例:
1. 人口大幅度攀升:
the number of population mounted dramatically
2. 人口轻微下降:
the number of population decreased slightly
3. 人口逐渐下降:
the number of population decreased gradually
好了,我们现在已经说了两个范畴了, 这两个范畴可以帮你搞定任何线段组的描述。紧接下来我们要讨论的是如何将线段组与数据进行连接。非常简单, 注意如下的介词使用。
一. remain steady / stay stable / level off / bottom out / peak / reach its peak / reach its zenith 后面需要使用的是 at .
举例:
1. 人口在500万上保持平稳:
the number of population remained steady at 5 million
1. 人口在800万时到达了顶峰:
the number of population peaked at 8 million
2. 下降后, 人口在400万保持平稳:
after decreasing, the number of population bottomed out at 4 million
3. 上升后, 人口在700万保持平稳:
after mounting, the number of population leveled off at 7 million
二. 上升/下降后面使用to(到)和by(了)
举例:
1. 人口下降到200万:
the number of population decreased to 2 million.
2. 人口下降了200万:
the number of population decreased by 2 million.
3. 人口上升到1000万:
the number of population increased to 10 million.
4. 人口上升了500万:
the number of population increased by 5 million.
三. recover的后面大家需要使用的是from
举例: 人口在200万时开始复苏:number of population recovered from 2 million.
四. fluctuate 的后面大家需要连接 between ...... and ......
举例:
人口在2和100亿之间波动:
the number of population fluctuated between 2 and 10 billion(那俩人是ADAM和EVE)
u 雅思图表作文经典用词总结手册
1.有用的词
上升:increase、rise、 ascend 、core、 surge 、go up 、climb 、mount、 level up
下降: decrease、 fall 、drop、 descend、 decline 、reduce 、lessen、 level down
平稳:stable 、steady、 remain/maintain/keep/be the same as/similar to
波动:fluctuate、 fluctuation、 rise and falls、 up and down
占:occupy、 take up、 account for、 gain
而:while、 howeve、r whereas、 on the other hand、 actually/in fact
相比:by contract、 on the contrary、 likewise、 compared with
最高点:the highest 、the top、 the summit 、the peak、 the most
最低点:bottom 、less 、least 、rock bottom
平均:mean、 average
趋势:tendancy 、trend、 inclination
预见:prediction
达到顶峰: mount to
在***中占***:***gain the percentage of
有一个稳定的过程:a stable period can be seen
2.分项目的总结
在做这个之前,把“模板”说一下:
第一段:The***(某种图,比如bar chart ,pie chart或是curve graph)show***(简单写写情况,比如“妇女受教育程度”,“美国能源利用”,这些一般可以在图下面的说明文字中找到),From the ***(某种土)we can have a understanding of ***(又是什么情况)
注:第二句话是废话,是为了凑字数,字数够了的时候就可以不用了,当然写的时候注意表达方式的一些小改动
第二段:说明段,From the***/***illustrate*** +一些内容,主要写以下几个方面:极点(极大,极小),趋势,特别点(交点,转折点,相同点和一些在特定图上有意义的点)
第三段:From the chart,we may have a basic understanding of the situation of——凑字数用的!!
3. 一些表达:
A.柱形图
increase rise go up / drop decrease decline
B.饼图
***is dividedsintos***parts ***consume the largest prtion ***accounting for***
***(百分比)of ***is*** ***play a very important role in ***
C.线形图
From this point Drop/increase dramaticly a modest /rapid increase
1.以时间为比较基础的应抓住“变化”:上升,下降,或是波动,题中对两个或两个以上的变量进行描述时应在此基础上进行比较,如变量多于两个应进行分类或有侧重的比较。
2.不以时间为比较基础的应注意对极点的描述。
该数据(字)可以这样理解……
u 经典语句
一、图表作文写作常识
1、图形种类及概述法:
泛指一份数据图表:a data graph/chart/diagram/illustration/table
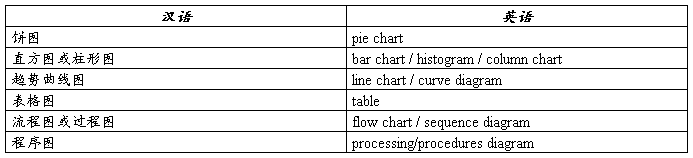
饼图:pie chart
直方图或柱形图:bar chart / histogram
趋势曲线图:line chart / curve diagram
表格图:table
流程图或过程图:flow chart / sequence diagram
程序图:processing/procedures diagram
2、常用的描述用法
The table/chart diagram/graph shows (that)
According to the table/chart diagram/graph
As (is) shown in the table/chart diagram/graph
As can be seen from the table/chart/diagram/graph/figures,
figures/statistics shows (that)……
It can be seen from the figures/statistics
We can see from the figures/statistics
It is clear from the figures/statistics
It is apparent from the figures/statistics
table/chart/diagram/graph figures (that) ……
table/chart/diagram/graph shows/describes/illustrates how……
3、图表中的数据(Data)具体表达法
数据(Data)在某一个时间段固定不变:fixed in time
在一系列的时间段中转变:changes over time
持续变化的data在不同情况下:
增加:increase / raise / rise / go up ……
减少:decrease / grow down / drop / fall ……
波动:fluctuate / rebound / undulate / wave ……
稳定:remain stable / stabilize / level off ……
最常用的两种表达法:
动词+副词形式(Verb+Adverb form)
形容词+名词形式(Adjective+Noun form)
二、相关常用词组
1、主章开头
图表类型:table、chart、diagram、graph、column chart、pie graph
描述:show、describe、illustrate、can be seen from、clear、apparent、reveal、represent
内容:figure、statistic、number、percentage、proportion
2、表示数据变化的单词或者词组
rapid/rapidly 迅速的,飞快的,险峻的
dramatic/dramatically 戏剧性的,生动的
significant/significantly 有意义的,重大的,重要的
sharp/sharply 锐利的,明显的,急剧的
steep/steeply 急剧升降的
steady/steadily 稳固的,坚定不移的
gradual/gradually 渐进的,逐渐的
slow/slowly 缓慢的,不活跃的
slight/slightly 轻微的、略微地
stable/stably 稳定的
3、其它在描述中的常用到的词
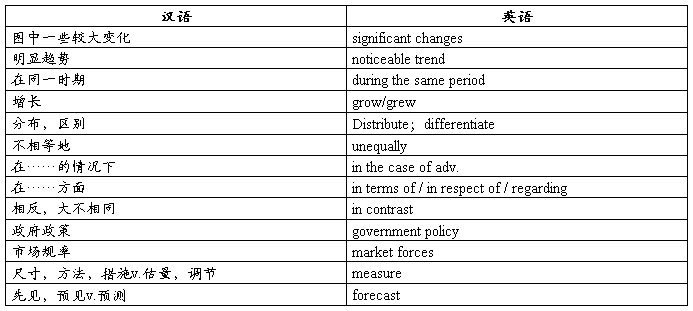
significant changes 图中一些较大变化
noticeable trend 明显趋势
during the same period 在同一时期
grow/grew 增长
distribute 分布,区别
unequally 不相等地
in the case of adv. 在……的情况下
in terms of / in respect of / regarding 在……方面
in contrast 相反,大不相同
government policy 政府政策
market forces 市场规率
measure n.尺寸,方法,措施v.估量,调节
forecast n.先见,预见v.预测
三、考雅英语图表写作套句精选
1.the table shows the changes in the number of…over the period from…to…
该表格描述了在……年之……年间……数量的变化。
2.the bar chart illustrates that……
该柱状图展示了……
3.the graph provides some interesting data regarding……
该图为我们提供了有关……有趣数据。
4.the diagram shows (that)……
该图向我们展示了……
5.the pie graph depicts (that)……
该圆形图揭示了……
6.this is a cure graph which describes the trend of……
这个曲线图描述了……的趋势。
7.the figures/statistics show (that)……
数据(字)表明……
8.the tree diagram reveals how……
该树型图向我们揭示了如何……
9.the data/statistics show (that)……
10.the data/statistics/figures lead us to the conclusion that……
这些数据资料令我们得出结论……
11.as is shown/demonstrated/exhibited in the diagram/graph/chart/table……
如图所示……
12.according to the chart/figures……
根据这些表(数字)……
13.as is shown in the table……
如表格所示……
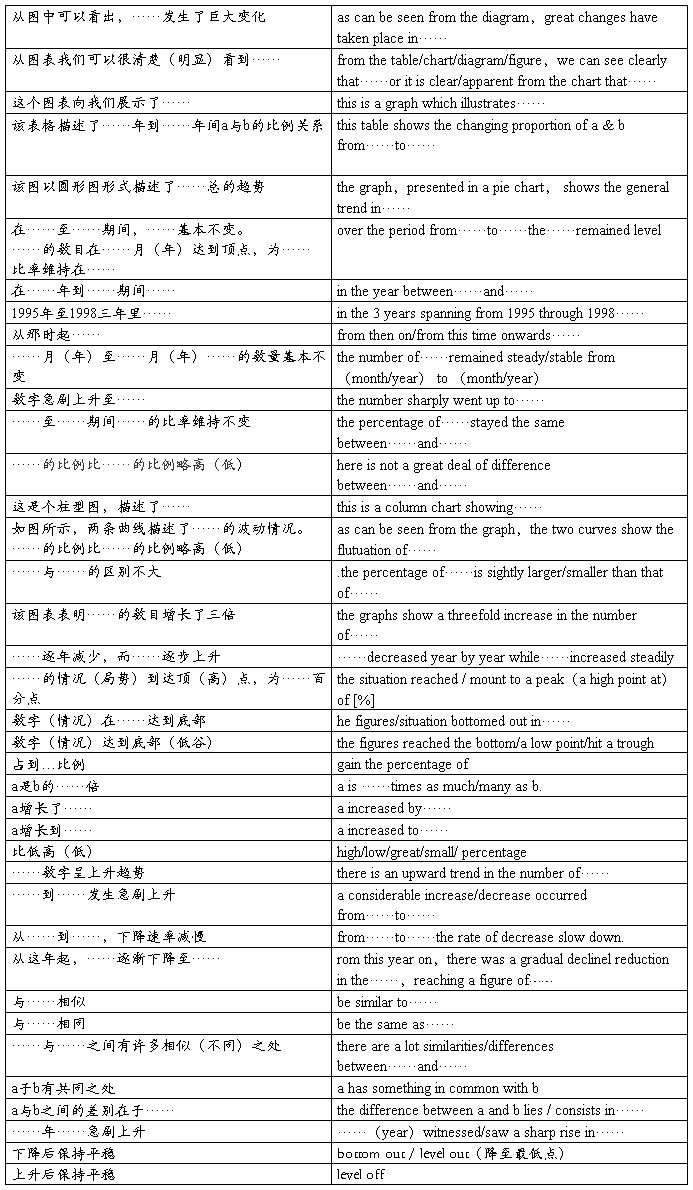
14.as can be seen from the diagram,great changes have taken place in……
从图中可以看出,……发生了巨大变化。
15.from the table/chart/diagram/figure,we can see clearly that……or it is clear/apparent from the chart that……
从图表我们可以很清楚(明显)看到……
16.this is a graph which illustrates……
这个图表向我们展示了……
17.this table shows the changing proportion of a & b from……to……
该表格描述了……年到……年间a与b的比例关系。
18.the graph,presented in a pie chart, shows the general trend in……
该图以圆形图形式描述了……总的趋势。
19.this is a column chart showing……
这是个柱型图,描述了……
20.as can be seen from the graph,the two curves show the flutuation of……
如图所示,两条曲线描述了……的波动情况。
21.over the period from……to……the……remained level.
在……至……期间,……基本不变。
22.in the year between……and……
在……年到……期间……
23.in the 3 years spanning from 1995 through 1998……
1995年至1998三年里……
24.from then on/from this time onwards……
从那时起……
25.the number of, remained steady/stable from (month/year) to (month/year)。
……月(年)至……月(年)……的数量基本不变。
26.the number sharply went up to……
数字急剧上升至……
27.the percentage of……stayed the same between……and……
……至……期间……的比率维持不变。
28.the figures peaked at……in(month/year)
……的数目在……月(年)达到顶点,为……
29.the percentage remained steady at……
比率维持在……
30.the percentage of……is sightly larger/smaller than that of……
……的比例比……的比例略高(低)。
31.there is not a great deal of difference between……and……
……与……的区别不大。
32.the graphs show a threefold increase in the number of……
该图表表明……的数目增长了三倍。
33……decreased year by year while……increased steadily.
……逐年减少,而……逐步上升。
34.the situation reached a peak(a high point at) of[%].
……的情况(局势)到达顶(高)点,为……百分点。
35.the figures/situation bottomed out in……
数字(情况)在……达到底部。
36.the figures reached the bottom/a low point/hit a trough.
数字(情况)达到底部(低谷)。
37.a is ……times as much/many as b.
a是b的……倍。
38.a increased by……
a增长了……
39.a increased to……
a增长到……
40.high/low/great/small/ percentage.
比低高(低)
41.there is an upward trend in the number of……
……数字呈上升趋势。
42.a considerable increase/decrease occurred from……to……
……到……发生急剧上升。
43.from……to……the rate of decrease slow down.
从……到……,下降速率减慢。
44.from this year on,there was a gradual decline reduction in the…,reaching a figure of…
从这年起,……逐渐下降至……
45.be similar to……
与……相似
46.be the same as……
与……相同
47.there are a lot similarities/differences between……and……
……与……之间有许多相似(不同)之处
48.a has something in common with b
a于b有共同之处。
49.the difference between a and b lies in……
a与b之间的差别在于……
50……(year)witnessed/saw a sharp rise in……
……年……急剧上升