英语四级图表作文讲解及参考范文
图表作文也是四(六)级考试中常见,而且被认为是一种较难的作文形式。图表作文就是把非文字信息(通常为各种图表表示的数字信息等)转换成文字信息的一种作文。它要求我们用文字来描述非文字性的图表或对图表显示的关系作解释说明。
第一节 图表作文的出题形式和写作要领
一、图表作文常见出题形式
图表作文一般在题目中给出作文的标题和一个或几个统计表格、圆形图、曲线图或条形图,有时还用英文或中文提纲的形式给出提示,要求我们:
1)用文字描述图表,客观解释图表中所传递的信息,并找出某种规律或趋势;
2)就图表中所反映的某种趋势或问题分析其原因或后果。
图表作文着重说明事实,常常是通过对图表中所反映的具体数据的说明、分析、比较,对某种事物或现象的事实或变化情况等加以说明,并提出结论或看法。因此,图表作文常常采用议论文体的写作方法。
写好图表作文,关键在于能否读懂图表中所提供的信息,把握各信息间的联系,用准确流畅的语言把这一信息表达出来,并就这一信息发表自己的看法。
二、图表作文的写作步骤
写图表作文时,要注意遵循以下步骤:
1)认真分析图表的含义,弄清图表中所含的信息及不同信息间的关系;
2)确定文章的主题思想,构思出文章的基本框架,筛选出能说明图表主题思想的典型数据;
3)编列文章的提纲;
4)根据文章的提纲,将各段的提纲内容扩展成段落,然后将各个段落组成文章,注意段与段之间的衔接与过渡;
5)检查与修改。
三、图表作文的篇章结构
写图表作文时,常采用三段式的陈述方式。文章的第一段往往分析图表中的数据变化反映什么问题或趋势,概述图表所揭示的信息。第二段分析造成这一问题或趋势的原因。第三段则展望未来的情况或提出解决问题的办法或建议。这一结构可以简单地表述为:
第一段:概述图表反映的主题思想(总趋势+极端值+特点,时态)
第二段:分析产生的原因
第三段:展望未来或提出方法或建议
模板一
① 总的趋势 ② 图表具体描述 ③剖析图表所揭示的含义
④理由一 ⑤ 理由二 ⑥理由三 ⑦ 理由四 ⑧总结 ⑨ 前景预测
As can be seen from the table, the
past decade has witnessed
dramatic changes in①______.
While ②_______. It is obvious from the table that③_________.
What contributed to these changes? I think the reasons are as follows. To start with, ④______. Secondly, ⑤______ . What’s more, ⑥ _______. Last but not lease, ⑦________.
In conclusion, ⑧_________. Moreover, ⑨ ________.
模板二
①描述图表 ②分三方面解释原因 ③下结论
1) During the period from _______to _______, ________rose from ________to _______, while _______ decreased from _______ to _______.
2) We believe that three reasons can account for this phenomenon. First,____. Second, ____. Third, _____.
3) ___.We are happy to see that things are becoming better and better nowadays. We can imagine that ___.
模板三
①描述图表 ②解释图表 ③补充解释
1) During the period between _______ and ________, ________ declined abruptly from _______ to ________, while ________ increased sharply from ________ to _______.
2) Several reasons can account for this phenomenon. Compared with _________ is much cheaper and more convenient__________ . Apart from that, _________.
3) However, there are still a number of people who _________, generally for two reasons. On the one hand,________. On the other hand, ________.
范文: Film Is Giving Way to TV
1. 电影观众越来越少
2. 电视观众越来越多,因为……
3. 然而,还是有人喜欢看电影,因为……
1.图表类型:
table 表格; chart 图表; diagram图表或图解,示意图; graph图表, 曲线图; column/ bar chart柱状图; pie graph饼图
2. 描述:
show; describe; illustrate; can be seen from; clear; apparent; reveal 显示; represent表现, 描绘
3.内容:
figure数字; statistic统计值; statistics [用作复]统计, 统计数字[资料], 统计表number; percentage; proportion
● 表示数据
上升:increase, rise, ascend, core, surge, go up, climb, mount, level up
下降: decrease, fall, drop, descend, decline, reduce ,lessen, level, down
平稳: stable, steady, remain steady/stable; /maintain/keep/be the same as/similar to ; little/hardly any /no change
波动: fluctuate, fluctuation, rise and falls, up and down
占: occupy, take up, account for, gain
而: while, however, whereas , on the other hand, actually/in fact
相比: by contract, on the contrary, likewise, compared with
最高点: the highest, the top, the summit, the peak, the most
最低点: bottom, less, least, rock bottom最低点
例句Prices have hit rock bottom. 价格已达最低水平
平均: mean平均值, average
趋势: tendency, trend, inclination
预见: prediction
达到顶峰: mount to
比例:20 per cent , 20%
one in three, 1/3
one out of every four, 1/4
有一个稳定的过程: a stable period can be seen
表示 变化程度的词:
sudden/suddenly 突然的,意外的
rapid/rapidly 迅速的,飞快的,险峻的
dramatic/dramatically 戏剧性的,生动的
significant/significantly 有意义的,重大的,重要的
sharp/sharply 明显的,急剧的
steep/steeply 急剧升降的
steady/steadily 稳固的,坚定不移的
gradual/gradually 渐进的,逐渐的
slow/slowly 缓慢的,不活跃的
slight/slightly 轻微的、略微地
stable/stably 稳定的
表示范围:
from…to… between…and… for …to …多长时间直到
表示程度:
almost adv. 几乎,差不多
nearly adv. 几乎,密切地
approximately adv. 近似的,大约
just over 刚超过
exactly adv. 正确地,严密地
precisely adv. 正好 精确地;清晰地
● 常用词和短语
significant changes 图中一些较大变化
noticeable trend 明显趋势
during the same period 在同一时期
grow/grew 增长
distribute 分布,区别
unequally 不相等地
pronounced 明显的
average 平均
no doubt 无疑地
corresponding adj. 相应的,通讯的
represent vt. 阐述,表现
overall 体上讲
except 除外
in the case of adv. 在…的情况下
in contrast 相反,大不相同
in conclusion adv. 最后,总之
in comparison 相比之下
inversely adv. 相反地,倒转地
in general 通常,大体上,一般而言
rang from…to 从…到…不等
excessive adj. 过多的,过分的,额外
lower v. 降低,跌落
elapse vi. (时间)过去,消逝
category n. 种类
government policy 政府政策
market forces 市场规律
measure n. 尺寸,方法,措施 v.估量,调节
forecast n. 先见,预见
表示程度的副词:
1.)程度较大:
considerably dramatically greatly markedly obviously quickly rapidly sharply significantly suddenly
2) 程度较小:
slightly gradually slowly steadily
四、图表作文常用的句型
(1)常用的开篇句型(即概述图表内容时常用的表达法)
① According to the table/pie chart/line graph/bar graph, we can see/conclude that … 根据该表/图,我们可知 ……
② The table/graph reveals (shows/indicates/illustrates/ represents/points out) that … 该表/图表明……
③ As we can see from the table …
As can be seen from the line/bar graph …
As is shown (illustrated/indicated) in the pie chart …
如表/图所示,……
(2) 描述增减变化常用的句型
① Compared with … is still increased by …
② The number of … grew/rose from … to …
③ An increase is shown in …; then came a sharp increase of …
④ In … the number remains the same/drops to …
⑤ There was a very slight (small/slow/gradual) rise/increase in 1990.
⑥ There was a very steady (marked/sharp/rapid/sudden/ dramatic) drop (decrease/decline/fall/reduction) in 1998/ compared with that of last year).
来看一篇范文:
⑴ From the graph, we can see that the number of car accidents in Walton city fluctuated during the year of 1990. ⑵ The first two months of 1990 showed an increasing trend. ⑶ The rate rose to 32 in March but fell to 26 in June. ⑷ From June on, the rate was rising again and reached the peak point 39 in August. ⑸ After August the rate began to decline remarkably, and eventually dropped to the lowest point 16 at the end of the year. ⑹ Therefore, it’s obvious that car accident in Walton city declined in 1990.⑴主题句/概述表格反映的内容⑵—(5)反映交通事故的变化情况(6)小结:总结表格数据反映的总趋势
⑺There are several reasons for the decline. ⑻ First, a new traffic law was made and came into force. ⑼ It provided that in summer every car must be air-conditioned. ⑽ As a result, the highest rate in August, when humidity and high temperature make drivers impatient and easily lead to car accidents, dropped steadily. ⑾ Second, new roads were built and some narrow streets were widened, which quickened the flow of traffic. ⑿ Finally, the city administration made great efforts to heighten people’s awareness of observing traffic rules.⑺主题句⑻原因/措施一⑼解释措施一/次要辅助⑽采取措施一后的结果⑾原因/措施二⑿原因/措施三
⒀ With all these new measures, I’m sure the rate of car accidents in Walton city will go on falling this year.⒀总结:展望未来的情况
第二节图表作文样题与样文举例
样题一:
Directions: For this part, you are allowed 30 minutes to write a composition on the topic How People Spend Their Holidays. You should write at least 120 words, and base your composition on the table and the outline given below:
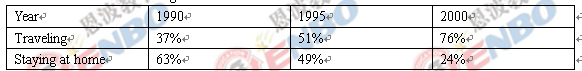
1、根据上表,简要描述1990年、1995年、20##年某城市人们度假方式的情况及其变化;
2、请说明发生这些变化的原因;
3、得出结论。
How People Spend Their Holidays
As is clearly shown in the table that there was a dramatic change in the way people spent their holidays between 1990 and 2000. Especially, in 1990, 63% of people spent their holidays at home, while the figure decreased considerably to 24% in 2000. There are three reasons for this phenomenon.
To begin with, with the development of market-oriented economy, people earn by far more money than they used to, making it possible for them to afford traveling expenses. In addition, people realize the importance of getting well-informed about the outside world in this modern era to develop their potential. For example, a traveler may encounter or talk with someone of a different cultural background so as to broaden his vision. Last but not least, by traveling outside, people are close to nature, which is not only beneficial to both their health and peace of mind. In short, more and more people take the occasion of holiday to travel outside and relax themselves.
As far as I am concerned, I prefer to go traveling instead of staying at home during holidays. On the one hand, I love meeting different people and take in some fresh ideas. On the other hand, it is agreed that the world is becoming a global village. No one could confine himself within his small circle of families or relatives. In brief, I have benefited a lot and will benefit more from traveling during the holidays.
点评:该篇作文属图表作文,命题思路与四级真题图表作文一致,仿真度高。本预测题关于人们旅游度假方式的变化,也是社会热点话题,20##年1月就考过名校校园该不该成为旅游景点话题;20##年6月也是关于旅游景点的介绍。
样题二:
The Pursuit of A Master’s Degree
a. 根据下图描述某校毕业生毕业意向的变化
b. 分析选择读研的毕业生数目增加的原因
c. 说明选择读研对个人和社会产生的影响

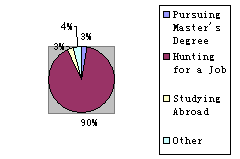
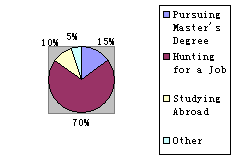
It is illustrated in the pie charts that graduates’ choices after graduation have experienced much change. The number of students choosing to pursue a master’s degree and study abroad grows several times over the decade.
The reasons of the increasing number of students pursuing a master’s degree are as follows. First, with the number of college graduates growing each year, the situation in the job market is getting tighter and tighter. The public awareness of the situation has created a surge of interest in seeking a master’s degree. Secondly, many cross-national companies set a much higher standard for new recruits than ever. It seems that the higher education you have, the higher salary you may receive.
Choosing to study for master’s degree will benefit the individuals and the whole society as well. The quality of Chinese intellectuals will be considerably enhanced, which in turn will boost the progress of the whole society.
样题三:
Direction: For this part you are allowed 30 minutes to write a composition on the topic :Cell Phones .You should write no less than 120 words and base your composition on the outline below:
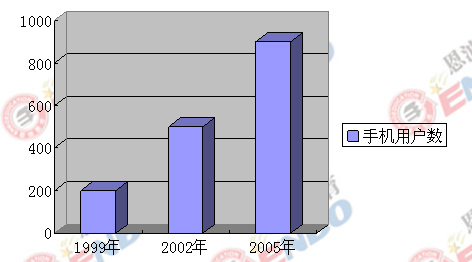
1. 描述上图所示的手机用户数的变化情况
2. 出现这种情况的原因
3. 对此现象作出评价
Cell Phones
As is shown in the chart, cell phones are becoming increasingly popular within China. In 1999, the number of cell phones in use was only 2 million, but in 2002, the number reaches 5 million. And in the year 2005, the number has suddenly soared to 9 million.
There are many factors contributing to this development. Firstly, a cell phone has no wires and can be carried everywhere easily. Secondly, a cell phone is something wonderful that we can have fun with news, games, music and chat through sending short messages. Thirdly, the drop in price and the simultaneous improvement in the functions have made it possible for an average person to make use of cell phone.
The wide use of cell phones has make them more and more indispensable in people’s daily life. The many functions of the cell phone have made certain people reluctant to separate themselves from their cell phone.
点评:随着我国经济的快速发展,人民的生活水平不断改善,通讯业的日新月异的发展,使得手机使用普及化,成为人们日常生活的必需品,对此的利弊人们看法各异。本预测题为热点话题,同样是年轻人较熟悉和经常讨论的话题,值得关注。
样题四:
Directions: For this part, you are allowed 30 minutes to write a short essay entitled Blog. You should write at least 120 words based on the chart and outline given below:
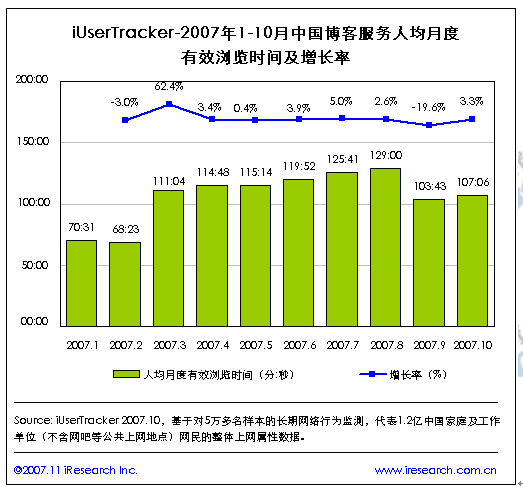
下图是20##年1-10月中国博客服务人均月度有效浏览时间及增长率,描述变化,说明原因。
Blog
This histogram (柱状图;直方图)shows the number of people using blog services from January to October in 2007. From it we can see that the number of users increased monthly from January to August, except February. After two peak months, July and August, the number dropped slightly in September, while in October it picked up again.
Possible reasons for these changes are first, in February Chinese people celebrated the most important festival——Chinese New Year. This means more people spent more time with their families and friends, and therefore they didn’t have as much time for surfing online. Secondly, college students are the main users of blog services. While in July and August,they had summer holidays, which enabled them to have more spare time reading and writing blogs. Thirdly, with improvements of blog services and the influence of some “star bloggers”, most of whom are celebrities, blogs are becoming an important way for people to express themselves and communicate with others. So more and more people are starting to use these services, which help explain the overall increase shown here.
点评:这是一篇图表题。可以看出,整体呈增长趋势。但是,二月和九月有所下降。所以,分析的时候要照顾各个方面。
样题五
For this part, you are required to write a composition about 120 words on the topic: Changes in People’s Daily Expenses. Your composition should be written on the following table and Chinese given below.
1. 描述图表中人们每天开支变化情况
2. 请说明发生这些变化的原因
3. 结合图表对未来作出合理的预测
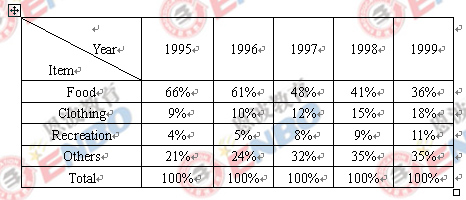
Changes in People’s Daily Expenses.
What is shown in the table above indicates that dramatic changes have taken place in the people’s daily expenses from 1995 to 1999. The expenses on food have declined by 30% while those on clothing and recreation have increased respectively by 9% and 7% . The statistics of rise and fall seem to exist in isolation but closely related to one another .
There are two factors accounting for these changes. Development in economy is an essential one in the five years. The increased income resulting from economic growth plays an important part in the less expense on food. Hence, a small percentage of total income is enough to cover food expense. Another one is the changes in life style. When food presents no worry to the average, people begin to focus more of interest on handsome appearance and happy leisure time . As a result of such a shift, spending on clothing and recreation increases year after year.
From the analyses made above, we may come to the conclusion that people’s living standards have been constantly improved between 1995 and 1999. With the further growth in economy and more changes in life style, the tendency indicated in the table will continue in the better direction .
点评:该预测题属于图表作文写作,与社会生活密切相关,与1991年6月份四级考试人们饮食结构的变化图表作文写作类似。根据四级图表作文命题规律,第一段描述人们1995到1999年日常开支所发生的巨大变化;第二段分析产生变化的原因;最后一段依据图表所示变化作出了合乎逻辑的预测。文章紧扣主题,条理清楚,语言连贯,表述准确规范,结论合理。
样题六
Changes in the Ownership of Houses (2003.6)
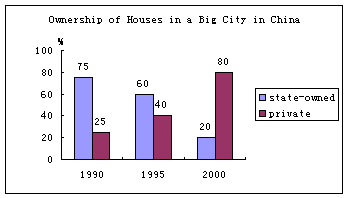
要求:1、根据上图描述该市住房产权的变化;
2、分析产生这些变化的原因;
3、说明这些变化对个人和社会产生的影响。
Changes in the Ownership of Houses
As is shown in the chart, great changes have taken place in the ownership of houses in the city. There has been a steady decline in the percentage of state-owned houses from 75 in 1990 to 20 in 2000. On the contrary, the percentage of private houses has been on the rise.
Several factors may account for the trend. For one thing, owing to the policy of reform and opening to the outside world, the past decade witnessed significant improvement in people’s standard of living. In other words, they have had the means to purchase houses of their own. For another, people’s ideas about consumption have undergone some radical changes. In the past, they were reluctant to spend, but now they are willing to buy. Anyway, it is much more comfortable to dwell in a house of one’s own.
These changes in the ownership have already had a positive effect on both individuals and society. Individuals, young people in particular, will be motivated to work harder to purchase a nest of their own. As a result, the housing industry will be boosted and more revenues will be raised to cover other sectors of our national economy.