计量经济学回归结果分析报告
本文主要用Eviews软件分析国内生产总值(gdp)与第一产业(dy)、第二产业(de)、第三产业(ds)、人均国内生产总值(rj)、工业(gy)及建筑业(jzy)之间的线性关系。
一、原始数据
原始数据来源于20xx年国家统计局统计年鉴中19xx年到20xx年的各指标数
据。
2-1 国内生产 总值
第二产业
工 业
人均国内 生产总值 (元) 381 419 463 492 528 583 695 858 963
本表按当年价格计算。 单位:亿元 年国 民 国内生份 产 1978 1979 1980 1981 1982 1983 1984 1985 1986
总收入
建筑业 138.2 143.8 195.5
第三产业
总第一值 产业
1027.
5 1270.
2 1371.
6 1559.
5 1777.
4 1978.
4 2316.
1 2564.
4 2788.
7
3645.2 3645.2 4062.6 4062.6 4545.6 4545.6
4889.5 4891.6 5330.5 5323.4 5985.6 5962.7 7243.8 7208.1 9040.7 9016.0
10274.10275.
4 2
1745.2 1607.0 1913.5 1769.7 2192.0 1996.5
2255.5 2048.4 2383.0 2162.3 2646.2 2375.6 3105.7 2789.0 3866.6 3448.7
4492.7 3967.0
872.5 878.9 982.0
207.1 1076.6 220.7
1163.0
270.6 1338.1 316.7 1786.3 417.9 2585.0 525.7 2993.8
1987 1988 1989 1990 12050.
6 15036.
8 17000.
9 18718.
3
12058.
6 15042.
8 16992.
3 18667.
8
3233.5251.6
3865.6587.2
4
4265.7278.0
9
5062.7717.4
0 4585.8 5777.2 6484.0 6858.0
665.8 3574.0 810.0 4590.3 794.0 5448.4 859.4 5888.4
1112 1366 1519 1644 19921826.
1 2 19926937.
2 3 19935260.
3 0 19948108.
4 5 19959810.
5 5 19970142.
6 5 19978060.
7 9 19983024.
8 3 19988479.
9 2 20098000.
0 5 200108061 8.2 200119092 5.7 200134973 7.0 200159454 3.6 200183615 7.4 200215906 4.4 21781.
5342.5 2
26923.
5866.5 6 35333.
6963.9 8 48197.
9572.9 7 60793.
121357 .8 71176.
140156 .4 78973.
144410 .9 84402.
148173 .6 89677.
147701 .0 99214.
149446 .7 10965157815.2 .3 12033165372.7 .0 135xxxxxxxx.8 .7 159xxxxxxxx.3 .7 184xxxxxxxx.4 .0 21631240404.4 .0 9102.2
8087.1 11699.
10284.
5 5 16454.
14188.
4 0 22445.
19480.
4 7 28679.
24950.
5 6 33835.
29447.
0 6 37543.
32921.
0 4 39004.
34018.
2 4 41033.
35861.
6 5 45555.
40033.
9 6 49512.
43580.
3 6 53896.
47431.
8 3 62436.
54945.
3 5 73904.
65210.
3 0 87598.
77230.
1 8 91310.
.5
9
1015.
7337.1 1 1415.
9357.4 0 2266.
11915.
5 7 2964.
16179.
7 8 3728.
19978.
8 5
4387.
23326.
4 2 4621.
26988.
6 1 4985.
30580.
8 5 5172.
33873.
1 4 5522.
38714.
3 0
5931.
44361.
7 6 6465.
49898.
5 9 7490.
56004.
8 7 8694.
64561.
3 3 10367
74919.
.3 3
12408
88554.
.6
9
1893 2311 2998 4044 5046 5846 6420 6796 7159 7858 8622 9398 10542 12336 14185 16500
103719
2007 2008 2009 2010 2011 266422.0 316030.3 340320.0 399759.5 472115.0 265810.3 314045.4 340902.8 401512.8 472881.6 28627
.0 33702
.0 35226
.0 40533
.6 47486
.2 125831
.4 149003
.4 157638
.8 187383
.2
220412
.8 110534.9 130260.2 135239.9 160722.2 188470.2 152xxxxxxxx
.5 .9 1874313134
.2 0.0 2239814803
.8 8.0 2666117359
.0 6.0 3194220498
.7 2.5
20169 23708 25608 30015
35181
注:1.19xx年以后国民总收入(原称国民生产总值)与国内生产总值的差额为国外净要素收入。 2.20xx年为初步核实数据。
二、线性关系分析
对国内生产总值(gdp)与第一产业(dy)、第二产业(de)、第三产业(ds)、
人均国内生产总值(rj)、工业(gy)及建筑业(jzy)两两关系做散点图,初步观察两两关系线性程度。
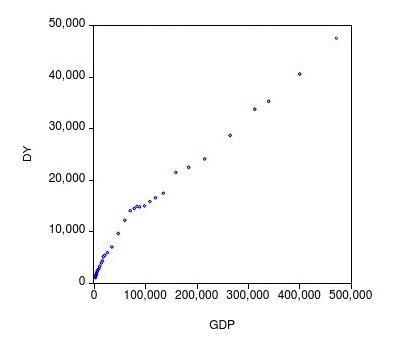
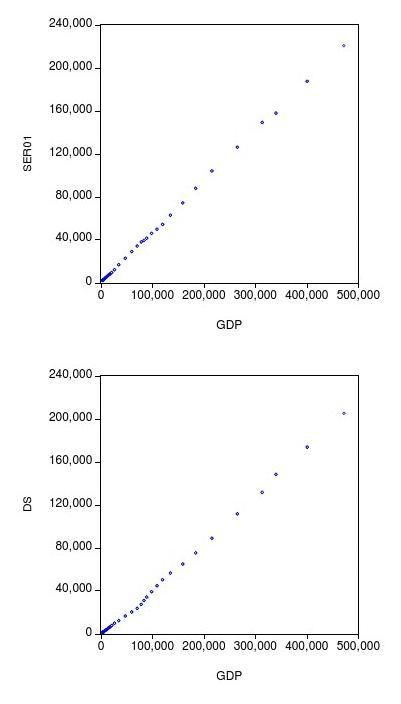
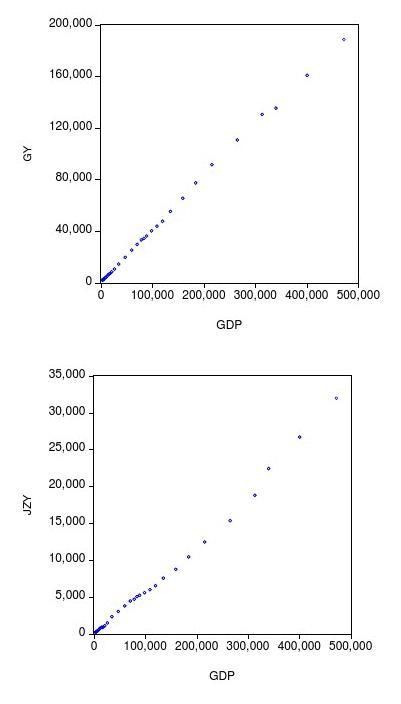
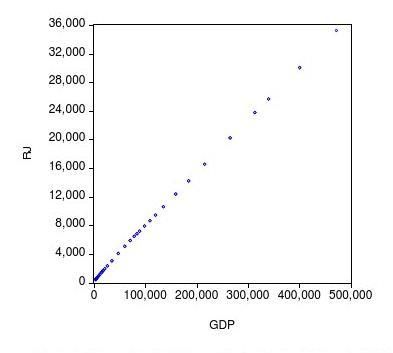
gdp)与第一产业(dy)、第二产业(de)、第三产业(ds)、人均国内生产总值(rj)、工业(gy)及建筑业(jzy)的两两关系都成比较明显的线性关系。
三、两两因果关系检验
??Pairwise Granger Causality Tests Date: 11/06/13 Time: 23:16 Sample: 1978 2011 Lags: 2
Null Hypothesis:
Obs 32
F-Statistic 2.22198 5.06890
Prob. 0.1278 0.0135
DY does not Granger Cause GDP GDP does not Granger Cause DY
??Pairwise Granger Causality Tests Date: 11/06/13 Time: 23:17 Sample: 1978 2011 Lags: 2
Null Hypothesis:
Obs 32
F-Statistic 0.13674 0.72231
Prob. 0.8728 0.4948
SER01 does not Granger Cause GDP GDP does not Granger Cause SER01
??Pairwise Granger Causality Tests Date: 11/06/13 Time: 23:17 Sample: 1978 2011 Lags: 2
Null Hypothesis:
Obs 32
F-Statistic 1.66457 0.22538
Prob. 0.2081 0.7997
DS does not Granger Cause GDP GDP does not Granger Cause DS
??Pairwise Granger Causality Tests Date: 11/06/13 Time: 23:17 Sample: 1978 2011 Lags: 2
Null Hypothesis:
Obs 32
F-Statistic 0.64216 1.19926
Prob. 0.5340 0.3170
GY does not Granger Cause GDP GDP does not Granger Cause GY
??Pairwise Granger Causality Tests Date: 11/06/13 Time: 23:18 Sample: 1978 2011 Lags: 2
Null Hypothesis:
Obs 32
F-Statistic 1.76785 0.51744
Prob. 0.1899 0.6018
JZY does not Granger Cause GDP GDP does not Granger Cause JZY
??Pairwise Granger Causality Tests Date: 11/06/13 Time: 23:18 Sample: 1978 2011 Lags: 2
Null Hypothesis:
Obs 32
F-Statistic 3.86265
Prob. 0.0335
RJ does not Granger Cause GDP
GDP does not Granger Cause RJ 4.30495
0.0238
从以上因果关系检验可以看出,dy是gdp的因;de不是gdp的因;ds是gdp的因;不拒绝gy是gdp的因;jzy是gdp的因;rj是gdp的因。
四、方程估计
Estimation Command:
========================= LS GDP DY DE DS GY JZY RJ
Estimation Equation:
=========================
GDP = C(1)*DY + C(2)*SER01 + C(3)*DS + C(4)*GY + C(5)*JZY + C(6)*RJ
Substituted Coefficients: =========================
GDP = 1.0000217488*DY + 0.534872990318*SER01 + 1.00001422644*DS + 0.465131579548*GY + 0.465118223222*JZY - 0.000127460781932*RJ
Estimation Command:
========================= LS GDP DY DS GY JZY RJ
Estimation Equation:
=========================
GDP = C(1)*DY + C(2)*DS + C(3)*GY + C(4)*JZY + C(5)*RJ
Substituted Coefficients: =========================
GDP = 1.00001312447*DY + 1.00001074472*DS + 0.99999925699*GY + 0.999985516649*JZY - 6.23570668064e-05*RJ
五、多元线性回归分析
??Dependent Variable: GDP Method: Least Squares Date: 11/06/13 Time: 22:28 Sample: 1978 2011 Included observations: 34
Coefficien
Std. Error
t-Statistic
Prob.
t
1.00002174880404
DY
2
0.53487299031751
SER01
75
1.00001422643701
DS
6
0.46513157954785
GY
26 0.46511822322238
JZY
63
-0.00012746078193
RJ
16575 0.99999999999993
R-squared
87 Mean dependent var
0.99999999999992
Adjusted R-squared
78 S.D. dependent var
0.03363467419225
S.E. of regression
155 Akaike info criterion 0.03167615662452
Sum squared resid
955 Schwarz criterion 70.3914664366339
Log likelihood
7 Hannan-Quinn criter.
2.49262874940735
Durbin-Watson stat
1
??Dependent Variable: GDP Method: Least Squares Date: 11/07/13 Time: 17:01 Sample: 1978 2011
0.173xxxxxxxx57074 0.000127170012932923
4
-1.00228645
8828053 2.679414641503644
0.173xxxxxxxx59382
2.679489660989856
0.173xxxxxxxx1815 9.146xxxxxxxx5292e-0
6
109327.7422806412 3.081219330097514
1.893728633415722e-0
5
52807.02478476557
1.582446492756379e-113 0.00459033280652
9332 2.239989772638359e-122 0.01220766580898
526 0.01220983269048
712 0.32478890553989
67
101654.697058823
5
125124.250192640
9
-3.78773331980199
8
-3.51837558016385
1
-3.69587461642697
3
Included observations: 34
DY DS GY JZY RJ
R-squared
Coefficien
t
1.000013 1.000011 0.999999 0.999986 -6.24E-05
Std. Error
2.13E-05 1.03E-05 1.10E-05 1.25E-05 0.000143
t-Statistic
46982.45 96943.70 91172.55 79709.91 -0.437553
Prob.
0.0000 0.0000 0.0000 0.0000 0.6650
101654.7 125124.3 -3.555654 -3.331189 -3.479105
1.000000 Mean dependent var 1.000000 S.D. dependent var 0.038224 Akaike info criterion 0.042371 Schwarz criterion 65.44612 Hannan-Quinn criter. 2.254318
Adjusted R-squared S.E. of regression Sum squared resid Log likelihood Durbin-Watson stat
结合三、四、五,最后得到回归方程
GDP = 1.000*DY + 1.000*DS + 1.000*GY + 1.000*JZY - 6.23570668064e-05*RJ