雅思写作图表类套句
1.The bar chart illustrates that... 该柱状图展示了...
2.The graph provides some interesting data regarding...该图为我们提供了有关...有趣数据。
3.The diagram shows (that)...该图向我们展示了...
4.The pie graph depicts (that)....该圆形图揭示了...
5.This is a cure graph which describes the trend of...这个曲线图描述了...的趋势。
6.The figures/statistics show (that)...数据(字)表明...
7.The tree diagram reveals how...该树型图向我们揭示了如何...
8.The data/statistics show (that)...该数据(字)可以这样理解...
9.The data/statistics/figures lead us to the conclusion that...这些数据资料令我们得出结论...
10.According to the chart/figures...根据这些表(数字)...
11.As is shown in the table...如表格所示...
12.As can be seen from the diagram,great changes have taken place in... 从图中可以看出,...发生了巨大变化。
13.From the table/chart/diagram/figure,we can see clearly that...or it is clear/apparent from the chart that...从图表我们可以很清楚(明显)看到...
14.This is a graph which illustrates...这个图表向我们展示了...
15.This table shows the changing proportion of a & b from..to...
该表格描述了...年到...年间a与b的比例关系。
16.The graph,presented in a pie chart, shows the general trend in... 该图以圆形图形式描述了...总的趋势。
17.This is a column chart showing...这是个柱型图,描述了...
18.As can be seen from the graph,the two curves show the fluctuation of... 如图所示,两条曲线描述了...的波动情况。
19.Over the period from..to...the...remained level.在...至...期间,...基本不变。
20.In the year between...to.. 在...年到...期间...
21.In the 3 years spanning from 1995 through 1998... 19xx年至1998三年里...
22.From then on/from this time onwards... 从那时起...
23.The number of...remained steady/stable from (month/year) to (month/year) ....月(年)至...月(年)...的数量基本不变。
24.The number sharply went up to...数字急剧上升至...
25.The percentage of...stayed the same between...to..
...至...期间...的比率维持不变。
26.The figures peaked at...in(month/year)
...的数目在...月(年)达到顶点,为...
27.The percentage remained steady at...比率维持在...
28.The graphs show a threefold increase in the number of...
该图表表明...的数目增长了三倍。
29.The situation reached a peak(a high point at) of[%].
...的情况(局势)到达顶(高)点,为...百分点。
30.The figures/situation bottomed out in...数字(情况)在...达到底部。
31.The figures reached the bottom/a low point/hit a trough.
数字(情况)达到底部(低谷)。
32.a is ...times as much/many as b.a是b的...倍。
33.a increased by...a增长了...
34.a increased to...a增长到...
35.high/low/great/small/ percentage.比低高(低)
36.there is an upward trend in the number of......数字呈上升趋势。
37.A considerable increase/decrease occurred from.123..到..发生急剧上升。
38.From..123...the rate of decrease slow down.从...到...,下降速率减慢。
39.There are a lot similarities/differences between...a12..
...与...之间有许多相似(不同)之处
40.a has something in common with b a于b有共同之处。
41.the difference between a and b lies in... a与b之间的差别在于...
42...(year)witnessed/saw a sharp rise in... ...年...急剧上升。
第二篇:雅思 图表作文写作技巧
 Task1图表作文写作技巧(一)
一、 认识图表作文
20分钟150单词,占写作考试总分值的三分之一,描述一个或几个图表。
线性图(line graph/chart);柱状图(bar graph/chart);饼状图(pie graph/chart);表格(table);流程图(process diagram)
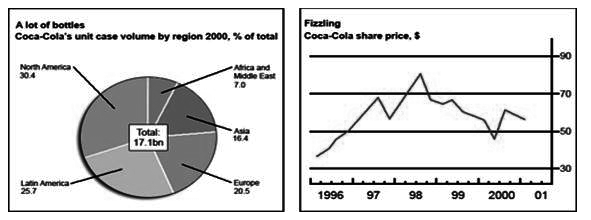
Table:

二、 图表作文审题要素
1. 描述对象
整个图表的数据都是针对描述对象的。图表的上方标题一般会指示描述对象。弄清描述对象非常重要,因为在行文时,需要频繁地用到它。
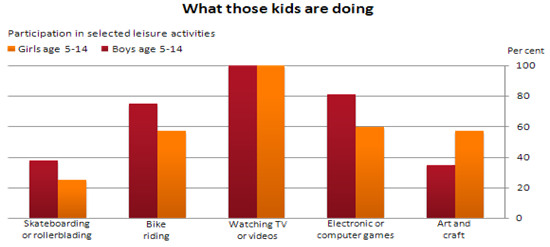
如:sales of Coca Cola, share price of Coca Cola, the preferred leisure activities of Australian kids aged 5-14, wages growth rate。
2. 描述单位
对于有X轴(horizontal axis)和Y轴(vertical axis)的图表,描述单位一般在Y轴以符号的形式标明。弄清描述单位对于数据的准确描述非常关键,把握不准的话就容易被当做跑题。一般要弄清数字(number)和百分比(percentage; proportion)的区别。另外,记住几个常用的单位缩写符号:
$: dollar
bn: billion
m: million 或 metre
km: kilometre
%: percentage / proportion 区别:per cent
,000s: thousand
比如,第一页的描述单位:bottle / percentage (pie chart), dollar (line chart), percentage (bar chart)
三、 图表作文标准结构
Part 1 开头段,介绍写作目的,需包含四个要素:
 图表类型
图表类型
主要描述动词
describe, show, present, depict, indicate, represent
compare / make a comparison between …
描述对象
背景信息(地点 + 时间)
例如:
The line graphgives some detailed information aboutthe wages growth rateof some country over a decade from 1993 to 20##.
The pie charts below show the percentage of men and women who smoked in Australia during a 40-year period, between 1960 and 2000.
Part 2 主体段:1 + N结构
1: 一句话概括总趋势或总特征(general trend or feature)
套句:… have shown striking changes/differences.
N: N段(N≥1)细节描述(striking trends or features)
Part 3 结尾段
结尾段给出结论。结尾段是可选的,如果时间紧张或前面几段字数已够的话可以省去不写。甚至总趋势或总特征描述段也可以不写。
示例:
The graph below gives information on wages of some country over a ten-year period. Write a report for a university tutor describing the information shown.
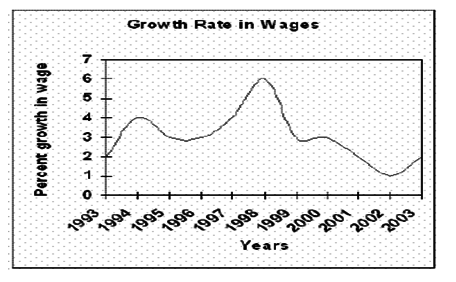
The line graph describes the growth rate of wages in some country from year 1993 to year 2003.
As can be seen from the graph, the wage growth rate shows a feature of significant fluctuation within the decade.
The growth starts at two per cent in 1993, but it doesn’t stay there very long before it rapidly doubles in 1994. Further on, the percentage declines to three per cent in 1995, stays steady for a year, before it starts to rise slowly and ends up at just under four per cent in 1997. 1998 is the best year where the wages rate peaks at six per cent.
However, after 1998 the wages rate declines nearly every year. Only a year after, the percentage drops to well under three per cent, stays there at roughly three per cent till 2000. In 20## the wages rate reaches the lowest point of just one per cent growth. Luckily the growth rises in 20## to just under two per cent.
Overall, the growth rate in wages in some country has shown striking changes through the ten years. (183 words)
TIPS
1. 时间段的表达(例:1993—2003)
between 1993 and 2003
from 1993 to 2003
over / during the years / period between 1993 and 2003
over / during the years / period from 1993 to 2003
over / during the years / period spanning from 1993 through 2003
over + 一段时间
2. 1+N中的1(总趋势或总特征)的引出结构:
As can be seen, …
As can be seen from the graph, …
According to the graph, …
The graph leads us to the fact that …
We can see from the graph that …
3. Task1中的时态问题
Task1对时态的要求也没有Task2那么严格。不论发生在过去还是现在的数据,都可以用一般现在时态;当然,也可以根据图表中的具体数据选择时态。如:如果图表中既有过去的数据,又有将来的数据,我们的处理方式有两种。第一种:全部用一般现在时态。第二种:发生在过去的数据用一般过去时,发生在现在的用一般现在时态,发生在将来的用一般将来时态。
四、 图表作文单项写作技巧
line graph: 3456N技巧
三大核心趋势描述句型及衍生句型、四大趋势、五个关键点、六组核心介词、N个程度词
1. 四大趋势
趋势与关键点是折线图写作的基本构成元素,之后的介词、程度词、趋势描述句型都是围绕着二者展开的。
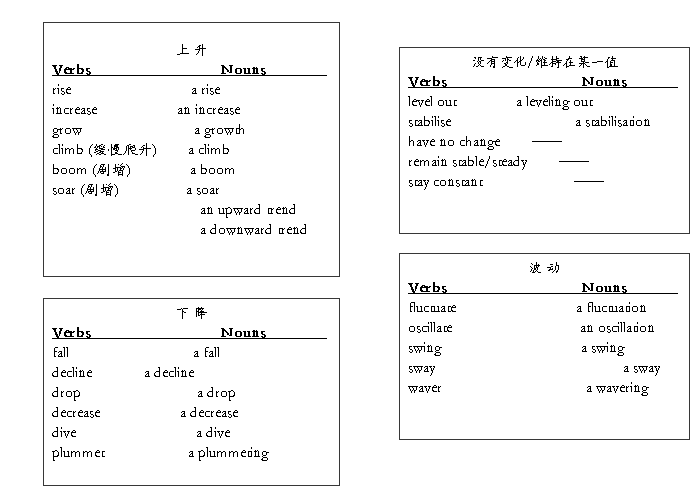
注:分别需记住各自的动词和名词形式,因为不同的词性要用在不同的趋势描述句型之中;
根据词性的不同,分别叫做“趋势动词”和“趋势名词”;
趋势描述名词前一般要加上不定冠词a/an。
2. 五个关键点
即starting point起点, ending/closing point终点, peak(highest point)最高点/最大值, bottom(lowest point)最低点/最小值, intersection/crossing point交叉点(常出现于多条线时)。
3. 六组关键介词
图表写作专用介词,与趋势动词或名词搭配,是准确描述趋势的基础与关键!
AT 在某一点(静态概念)
搭配:
begin / start at 以……值开始
end (up) / wind up / close at 以……值结束
peak at 达到最高值/点
bottom at 降到最低值/点
level out at 维持在……
stabilise at 维持在……
remain stable / steady at 维持在……
stay constant at 维持在……
stand / dwell at 在(任意的某一点)
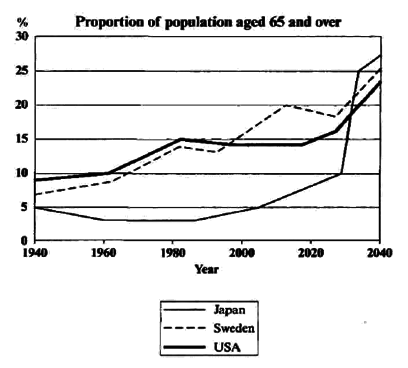
句型:In 2040, the percentage of Japan’s senior citizens aged 65 and above will be the highest, at about 27%. (at前的逗号可省略)
TO 上升或下降到某一点(动态概念)
搭配:趋势动词/名词 + to;趋势动词/名词 + from A to B
例如:
The wages growth rate rises to 6%. (趋势动词短语)
The wages growth rate shows a rise to 6%. (趋势名词短语)
The wages growth rate rises from 2% to 6%. (趋势动词短语)
The wages growth rate shows a rise from 2% to 6%. (趋势名词短语)
BY 上升或下降的幅度(相当于汉语的“了”,一般作为附加结构放在主要趋势描述句的后面)
例如:The wages growth rate rises from 2% to 6%, an increase by/of 4%. 或:
The wages growth rate rises by 4%. (这里不能用of)
AROUND 在某个点上下
搭配:fluctuate / oscillate / sway / waver / sway around
例如:The wages growth rate fluctuates around 3 per cent.
BETWEEN 在某个区间内
搭配:fluctuate / oscillate / sway / waver / sway between A and B
例如:The wages growth rate fluctuates between 2% and 4%.
ABOVE/OVER, UNDER/BELOW 在某个点之上或之下

 例如:The wages growth rate drops to under 3% in 1999.
(在图表作文里,像to和under两个介词堆砌在一起的情况是正常的,因为under和3%一起表示一个具体的点)
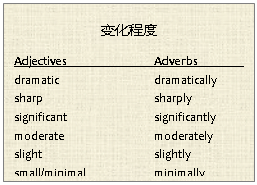
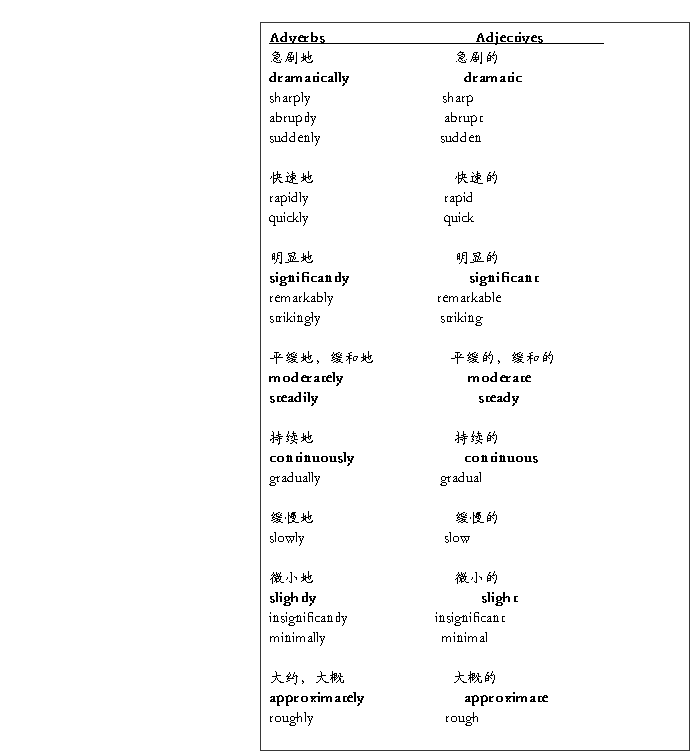
4. N个程度词
程度词用于修饰趋势动词或名词,使趋势描述更加精确。下框加粗的部分为重点掌握字汇。
exactly
precisely
5. 三大核心趋势描述句型
456N所涉及知识点都是为三大核心句型做准备。我们先从最基本的而趋势描述句型入手。
例句一:工资增长率从3%上升到6%。
句型一:描述对象 + 趋势动词短语
The wages growth raterises from 3% to 6%.
句型二:描述对象 + SEE / SHOW / EXPERIENCE + 趋势名词短语
The wages growth rate sees / shows / experiences a rise from 3% to 6%. (又见see结构!)
句型三:THERE IS + 趋势名词短语 + IN + 描述对象
There is a rise from 3% to 6% in the wages growth rate.
例句二:某个国家的工资增长率从1996年的约3%明显地增长到1998年的6%
注意到没?例句二在例句一的基础上增加了描述对象修饰语、时间(年份)、程度词等元素,在使用的时候需要注意把他们放在合适的位置。请看翻译:
句型一:
The wages growth rate of some countryrises remarkably from roughly 3% in 1996 to 6% in 1998.
句型二:
The wages growth rate of some country shows a remarkable rise from roughly 3% in 1996 to 6% in 1998.
句型三:
There is a remarkable rise from roughly 3% in 1996 to 6% in 1998 inthe wages growth rate of some country.
6. 趋势描述句型的衍生表达
三大基本句型是把起始值和结束值用一个趋势短语结合起来。在实际写作中,为了使句子富有变化,描述更加灵活,经常也会把趋势描述句型打散。另外,折线图经常以多线结合的形式出现,如果出现两条或多条线交叉的情况,还需要用相应的句型表达把交叉点前后各条线之间数值对比的变化描述出来。以下图为例。
A) 打散一个完整的趋势表达
例:美国65岁及以上人口比例从1940年的约8%明显地上升到20##年的约23%。
基本表达:The percentage of the USA’s citizens aged 65 and over grows significantly from around 8% in 1940 to approximately 23% in 2040.
衍生表达一:
The percentage of the USA’s citizens aged 65 and overstarts at around 8%, and then grows significantly to approximately 23% in 2040.
衍生表达二:
The percentage of the USA’s citizens aged 65 and overstarts at around 8%, grows significantly thereafter (从那之后), and finally closes at approximately 23% in 2040.
B) 描述一个总趋势里面的小趋势
例:美国65岁及以上人口比例从1940年的约8%明显地上升到20##年的约23%,但是在1980年到20##年之间有一个微小的下跌。
表达示例一:
The percentage of the USA’s citizens aged 65 and over grows significantly from around 8% in 1940 to approximately 23% in 2040. However, over the period between 1980 and 2020, the figure sees an insignificant downward trend. (注意:however在表达小趋势时的应用,另外,特别注意the figure经常用在图表作文里面用于替代重复、冗长的描述对象)
表达示例二:
The percentage of the USA’s citizens aged 65 and over grows significantly from around 8% in 1940 to approximately 23% in 2040, except over the period between 1980 and 2020, whenthe figure sees an insignificant downward trend. (注意:except和when引导的定语从句在表达小趋势时的应用)
C) 描述交叉点
对于两条线的交叉点,一般的处理方式是把交叉点前后的数值对比变化描述出来。有时也会交叉点所对应的具体数值。
例:
在1940年,瑞典65+的人口比例约7%, 比美国略低。之后,这个数值开始显著上升,并在20##年之后超过美国的65+人口比例。最后,这个数值在20##年以约25%结束。
注:这个范例实际上反映了多条折线写作(或者说是所有图标类型写作)的一个基本理念,即要多比较(如:比美国略低、超过美国65+人口比例)。
表达示例:
In 1940, the percentage of Sweden’s citizens aged 65 and over stands at around 7%, which is slightly lower than that of the USA. Afterwards, the figure begins to go up strikingly until it surpasses that of the USA after 2000, and finally closes at roughly 25% in 2040.
(注意:afterwards … until … and finally closes at 将整个交叉数据完整地描述出来。另外注意:surpass表示“超过”的意思)
D) 将B)小趋势和C)交叉点结合起来
对于示例中的瑞典曲线,光把它跟美国的曲线对比还是不够的,还需要把前者内部的小波动趋势指出来。
例:
在1940年,瑞典65+的人口比例约7%, 比美国略低。之后,这个数值开始显著上升,并在20##年之后超过美国的65+人口比例。最后,这个数值在20##年以约25%结束。值得注意的一点是,在1980到1990,以及2010到20##年之间,瑞典的这个数值呈现出略微的下降。(或:值得一提的是,在1980到20##年间,瑞典的这个数值呈现出略微的波动。)
表达示例:
In 1940, the percentage of Sweden’s citizens aged 65 and over stands at around 7%, which is slightly lower than that of the USA. Afterwards, the figure begins to go up strikingly until it surpasses that of the USA after 2000, and finally closes at roughly 25% in 2040. One noteworthy point is that the figure for Sweden shows slight declines between 1980 and 1990, as well as between 20## and 2030. (OR: One noteworthy point is that the figure for Sweden shows a slight fluctuation between 1980 and 2030.)
E) before表示“然后”
The proportion of Japan’s population aged 65 and over drops from exactly 5% in 1940 to about 3% in the 1980s, before it rises steadily to 10% in 2030. After that, …
F) 替代词:that of …. / the figure for …
The wages growth rate of the US keeps growing, while the figure for / that of Japan shows a continuous downward trend during the same period.
G) 关联词
while / whereas / whilst 而
例:The wages growth rate of the US keeps growing, while the figure for Japan shows a continuous downward trend during the same period.
specifically, to be specific 具体来讲
on the contrary, in/by contrast, on the other hand, unlike…, 与之相反
稍带主观性的关联词:interestingly 有趣地是 surprisingly, staggeringly 令人惊讶的是
alarmingly 值得警醒的是 unnervingly 令人担忧的是
五、 翻译练习
1. 某个国家的工资增长率从1993年的2%上升到了1994年的4%.
The rate of wage growth in some country rises from 2% in 1993 to 4% in 1994.
2. 可口可乐的股票价格(share price)从1998年的80%跌到了1999年的55%.
The share price of Coca-cola drops from 80% in 1998 to 55% in 1999.
3. 上世纪60年代到90年代澳大利亚男性烟民的数量呈波动特点。
The number of male smokers in Australia from 1960s to 1990s shows the feature of fluctuation.
4. 可口可乐的股票价格在1998年第三季度达到80%的峰值。
The share price of Coca-cola peaks at 80% in the third quarters of 1998.
5. 加拿大的小麦出口量在1989年跌倒1,400万吨的最低值。
The wheat exports in Canada bottoms at 14 million tons in 1989.
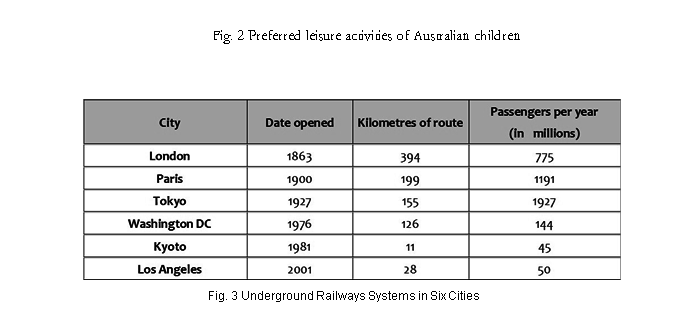
6. 伦敦地铁站的乘客数量从上午8点的400人陡然降到10点的180人,减少了220人。
The number of passengers in London Underground Station falls dramatically from 400 at 8 a.m. to 180 at 10 a.m., a decline by/of 220.
7. 澳大利亚日本游客的比例从1985年的2%迅速增长到1989年的7%,增加了5%。
The percentage of Japanese tourists in Australia booms from 2% in 1985 to 7% in 1989, an increase by/of 5%.
8. 某国十年间的工资增长率大致在3%上下波动。
The rate of wage growth of some country fluctuates around 3% within the decade.
9. 某国的工资增长率从20##年的1%爬升到20##年的2%以上。
The rate of wage growth in some country climbs from 1% in 20## to above 2% in 2003.
10. 欧盟的小麦出口量在20##年大致维持在3,200万吨的水平。
The wheat exports of EU level out approximately at 32 million tons.
六、 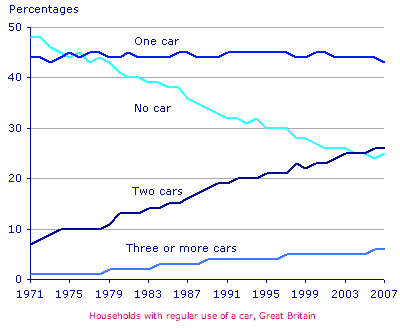 写作训练
写作训练
1. 填空题
The graph shows changes in households’ car ownership in Great Britain by _percentage_ _over_ a period of 36 years.
Overall, car ownership in Britain increased _between_ 1971 and 2007. In particular, the number of households with two cars rose, while the number of households _with_ a car fell.
In 1971, _nearly_ half of all British households did not have regular use of a car. Around 44% of households had one car, but only about 7% had two cars. It was uncommon for families to own three or more cars, _with_ around 2% of households falling into this category.
The one-car household was the most common type from the late 1970s _on_, although there was little change in the _percentage_ for this category. The biggest change was seen in the proportion of households without a car, which fell steadily over the 36-year period _to_ around 25% in 2007. In contrast, the proportion of two-car families rose steadily, reaching about 26% in 2007, and the proportion of households with more than two cars rose _to_ around 5%.
2. 写作训练
You should spend about 20 minutes on this task. The line graph below shows changes in the amount and type of fast food consumed by Australian teenagers from 1975 to 2000. Summarize the information by selecting and reporting the main features and make comparisons where relevant. Write at least 150 words.


