
计量经济学实验报告
学年:20##-2015年第一学期
学 院:
班 级:
学 号
姓 名:
指导老师:
实验2:多元线性回归
一.实验目的
掌握计量经济学多元模型的建立,模型形式的设定,模型拟合度、t检验和F检验判断过程;
二.实验环境
微型计算机(要求必须能够连接Internet,且安装有Eviews6.0软件。)
三. 实验步骤:
(1) 创建工作文件[File]--New--work file。在“work file”窗口中的“start date” 键入1983,在“end date”中键入2005,点击ok。
(2) 输入数据.在命令窗口输入DATA Q L K并回车. 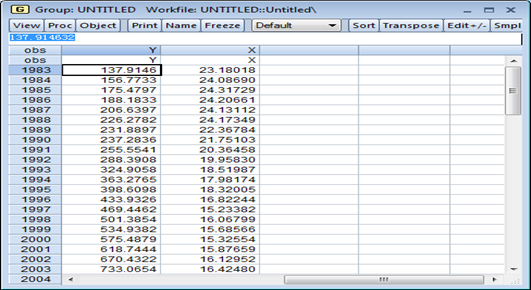
(3) 绘制散点图 在主菜单依次点击[quick]-[graph],在弹出的对话框中输入“y c x”点击[OK]-[Yes]后,出现“Group”窗口
通过散点图,我们发现人均GDP与人均污水排放量不是线性关系,而是一元二次的关系,因此我们可以通过转化使得二者成为线性关系。y与x之间的关系是非线性的,应该考虑建立非线性回归模型。假设生产函数满足C-D函数形式,即假定模型为:Y = A*X^B
代数变换:对模型两边取自然对数得 Iny = InA +B* Inx 令Yi = Iny β0 =
InA β1 = B β2 = Inx
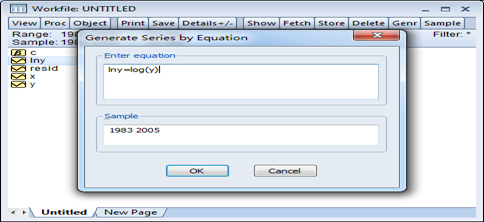
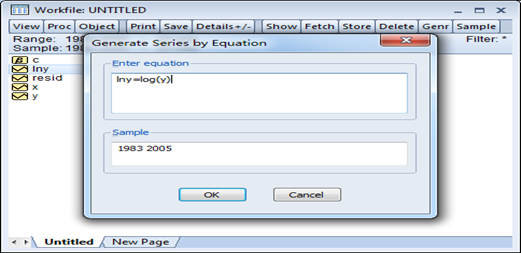
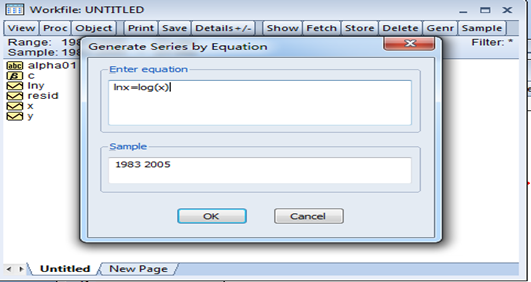
(4)生成新序列在主菜单点击[Quick]-[Generate Series],在文本框中输入描述新序
列的公式LNY=LOG(Y),点击[OK],
(5)参数估计
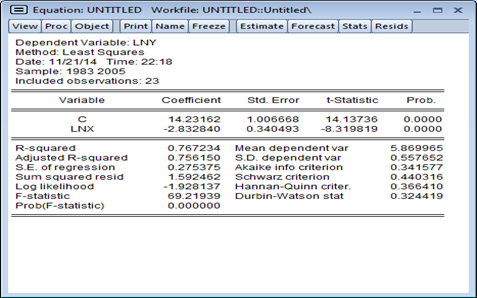
点击[Quick]-[Estimate Equation],在文本框输入“Lny C Lnx “

单击“确定”结果如下
四、实验结果及分析
Iny = 14.232 + —2.833*Inx
SE 1.007 0.340
T 14.137 —8.320
P 0.000 0.000
 R2 0.767 R2 0.756
F 69.220 P 0.000
通过散点图,我们可以发现开始环境污染程度随着GDP的增加而下降,到达最低值时,环境污染程度随着GDP的增加而上升。
本次试验曲线不符合库兹涅茨曲线,我们知道库兹涅茨曲线是上世纪50年代诺贝尔奖获得者、经济学家库兹涅茨用来分析人均收入水平与分配公平程度之间关系的一种学说。研究表明,收入不均现象随着经济增长先升后降,呈现倒U型曲线关系。此题曲线呈现正U曲线,故不符合。
第二篇:计量经济学实验八答案
1.

According to above table, we get the Durbin-Watson stat=0.627922 .
∵n=24 k=2,
Referring to the DW table ,we can get dl=1.27 du=1.45
∴there are first level positive relative between M and GDP
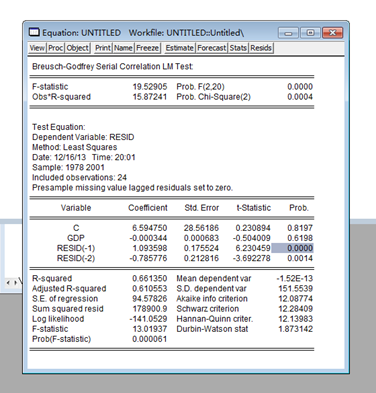
∵Obs*R-squared=15.8724>CHISQ(0.95,2)=5.991465
Besides t-statistic(resid(-1))= 6.230459>1.96besides t-Statistic(resid(-2))= -3.692278<-1.96
so there are second level relative between M and GDP
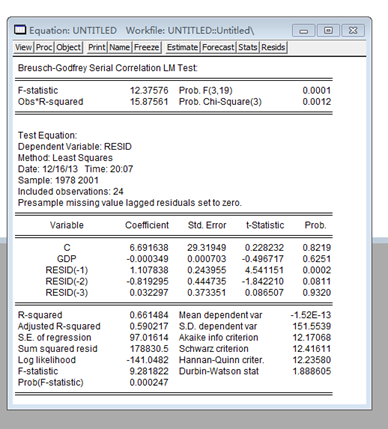
Because resid(-2) and resid(-3) are over 0.05, we can knowledge that here is not third-level positive
2.
3
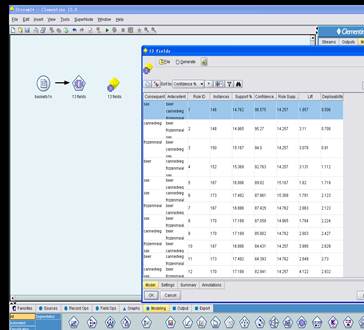
According to the picture we can conclude that the relationship between sex .cannedveg.frozenmeal and beer is tight
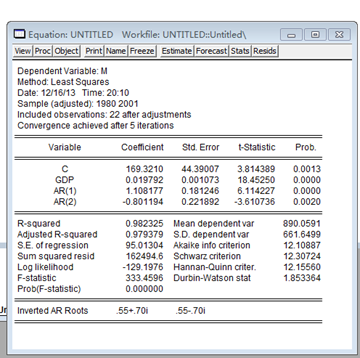
4.The following three equations were estimated using the 1,534 observations in 401K.RAW:

(1) Which of these three models do you prefer. Why?
I prefer to the second model. because ,the reasons is as following:
Comparing the above three equations, the second’s R-squard and Adjusted R-squard is maximum.
Referring to the rules of thumb,toetemp belongs to the total number, so it should use logarithmic functional form
all the t-Statistic of three Coefficient >1.96,so it is significant.
(2)Fill in the blanks in the estimation output for the second model.
