石油工程英语科技论文
写作期末报告
学号:
姓名:
学院:
日期:
英译中
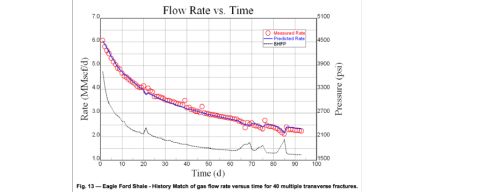
Figure 13 shows a history match of the predicted and measured gas flow rate and bottomhole flowing pressure data with time for the tail-in case. The history matched parameters were: propped fracture half-length ( xf= 157 ft ), dimensionless conductivity (CfD= 297 ), formation permeability (k = 12.2 nD ), and choked skin (Sch= 0.0173 ), as given in Table 7. As discussed previously, the created discrete fracture network and large stimulated reservoir volume account for what appears to be a short fracture length. A gas shale core analysis (rotary sidewall core) was performed on nine crushed 20/35 mesh size samples. The analysis showed matrix permeabilities ranging from 1 to 200 nD with an arithmetic average of 68 nD for the sample set.
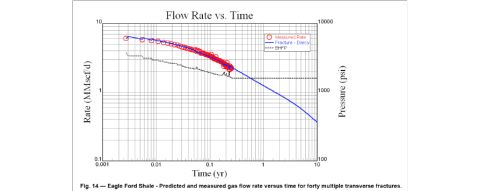
Figure 14 shows the predicted gas flow rate based on the history match parameters for a period of ten years. As illustrated, it will take about four years for the production rate to decrease to 10% of its initial value.
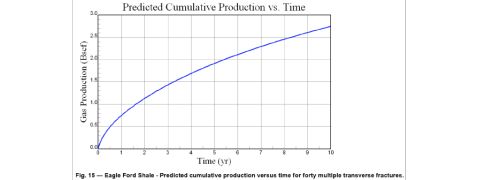
The predicted cumulative gas production as a function of time is shown in Figure 15. As illustrated, the cumulative gas production after one and ten years of production will be about 0.75 and 2.7 Bscf, respectively.
The time for interference with a formation diffusivity of 109 mD-psi/cp and fracture spacing of 100 feet is t = (237?η)Δy2?2.5 yr.
Optimization - Transverse Fractures in Horizontal Wells
Prats was the first to demonstrate that there is an optimum length-width ratio (dimensionless conductivity) for a given fracture volume that maximizes productivity. Prats showed that the optimum dimensionless conductivity for low penetrations was about 1.26 (i.e., CfD= π ? (2a) where the optimum value for a was about 1.25 for an ellipsoidal shaped fracture). The optimum value for a was later refined and shown to be equal to unity (Economides and Nolte (1987)).
Economides et al. (2002), also showed there existed an optimum fracture design for a given propped fracture volume. Their analysis was based on a dimensionless proppant number (Nprop) that was defined as twice the ratio of the propped fracture volume to reservoir volume multiplied by the fracture to reservoir permeability ratio.
Holditchet al. (1978) presented one of the first papers on the optimization of well spacing and fracture length in low permeability formations. Their objective was to present a simple technique for optimizing profit from a tight gas reservoir. Holditch performed sensitivity studies by varying such parameters as permeability, pay thickness, formation drainage area, propped fracture length, etc. Their analysis also included the variations on the economic parameters to determine the effect of gas price and discount rate upon the optimum results. Holditch concluded that “The values of the original pressure, porosity, net gas pay, drilling, completion and operating costs must all be considered to determine the optimum development plan for a given reservoir.”
Elrafie and Wattenbarger (1997) also presented an early paper on the economic evaluation of a horizontal well with four transverse fractures producing from the Upper Bahariyia reservoirs. This is a multi-zone oil reservoir with a 2 to 6 mD permeability in the horizontal and 0.3 to 1 mD permeability in the vertical for two zones, respectively. They presented cash flow and net present value (NPV) profiles for the study in order to evaluate the economic feasibility of the horizontal well. Investments and expenses to drill, complete, fracture, and operate the well were considered. Their final conclusion was “In the Upper Bahariyia reservoirs: for a horizontal well with a length of 1500 feet, the optimum number of transverse fractures is 4 with fracture spacing of 300 feet.”
The economic optimization methodology presented below is based on the concept of Net Present Value (NPV) and Discounted Return on Investment (DROI) as given in Appendix E. The objective of this study is to determine the optimum number of transverse fractures in a horizontal gas well for a hypothetical gas shale formation. The well, formation, and transverse fracture properties are given in Table 8. The economic inputs are given in Table 9.
译文:
图13显示了有尾随注入的情况下预计及实测天然气产量和井底流压随时间的变化。历史拟合的参数有:裂缝半长(xf?157ft),无因次导流系数(CfD?297),表皮系数(Sch?0.0173)以及地层渗透率(k?12.2nD),如表7所示。如前所述,离散裂缝网络和大量的支撑剂会导致较短的裂缝长度。我们针对9个破碎的20~35目岩心样本进行页岩气岩心分析(旋转井壁取心)。分析显示基质渗透率变化范围为1至200nD,样本基质渗透率的算术平均值为68nD。
产量(MMscf/d)
时间(天)
图13 Eagle Ford页岩气藏40条裂缝天然气产量与时间的关系的历史拟合
图14显示了十年内依据历史拟合参数预测的天然气产量。如图所示,生产大约4年后,天然气产量降至初期产量的10%。
产量(MMscf/d)
时间(年)
图14 Eagle Ford页岩气藏40条裂缝预测产量与实测产量随时间的变化
如图15所示,预测天然气累计产量是时间的函数。生产1年和10年后的天然气累计产量将分别达到约0.75和2.7Bscf。
天然
气产
量(
Bscf
)
时间(年)
图15 Eagle Ford页岩气藏40条裂缝预测累计产量随时间的变化
裂缝导流能力为109mD-psi/cp,裂缝间距为100英尺时,干扰时间t??237/???y2?2.5年 压力(psi)
水平井裂缝的最优化
Prats首次论证在裂缝体积一定时,存在最优的高宽比(无因次导流系数)使得裂缝具有最大的产量。Prats认为浅穿透裂缝的最佳无因此导流系数大约为1.26(即CfD??/?2a?,对于椭圆形裂缝,a的最佳取值约为1.25)。随后,Econnomides和Nolte(1987)优化了a的最佳取值。Economides等人(2002)论证了在压裂裂缝体积一定时,存在最佳的裂缝设计。他们的分析基于无因次支撑剂数目,(Nprop),无因次支撑剂数目等于2倍的裂缝体积除以油藏体积乘以裂缝与油藏渗透率之比。
Holditch等人(1978)发表了第一篇关于低渗透油气藏油井间距和裂缝长度的优化的论文。他们的目标是研发一个简便的方法实现低渗透气藏收益最大化。Holditch通过改变渗透率、产层厚度、泄油面积和裂缝长度等参数进行敏感性分析。他们还研究了天然气价格、折最佳开采计划扣率等经济学参数的改变对最佳结果的影响。Holdtch得出结论:为制定某一油藏的最佳开采计划,必须考虑地层原始压力、孔隙度、干气产层以及钻井、完井和生产的成本。
Elrafie和Warrenbarger(1997)也发表了一篇早期的有关水平井裂缝经济评价的文章,文章是关于上Baharyia油气藏,水平井压裂有4条裂缝。这是一个多区域的油藏,水平区域油藏渗透率为2-6mD,垂直区域渗透率为0.3-1mD。为评价水平井的经济可行性,他们分析了现金流和净现值。他们考虑了钻井、完井、压裂和生产的投资和成本。他们最终的结论是:在上Bahariyia油气藏,对于长为1500英尺的水平井,最佳的裂缝数量是4条,每条裂缝间距为300英尺。
以下所示的经济最优化方法是依据净现值(NPV)和投资利润率贴现(DROI),如附录E中所示。本研究的目的是为一个假设的页岩气藏水平井确定最佳的裂缝数目。井筒、页岩气藏和裂缝的性质如表8所示。经济投入如表9所示。
表8页岩气藏性质
页岩气藏 7500 深度(ft) 75 厚度(ft) 500 渗透率(nD) 5 孔隙度(%) 3400 孔隙压力(psi) 0.65 比重
200 温度(°F) 1864 扩散系数(mD-psi/cp) 160 泄油面积(acres) 1/2 高宽比,??xeye 500 井底流压(psi)
表9页岩气裂缝性质
井筒/裂缝 0.333 井眼半径(ft) 3000 水平段长度(ft)
800 裂缝长度(ft)
20 导流能力,kw(mD-ft) ff
无因次导流能力,CfD
表皮系数Sch
裂缝数目
150 0.003762 1-100 1Eq.7

表10页岩气藏经济数据
页岩气藏 单位天然气收入($/Mscf) 0 通胀系数(%)
0 收入增长率(%)
100 成本分担(%)
85 收入分担(%)
25,000 成本/裂缝($)
2,0 00,000 钻井成本($)
中译英
文章一
压裂液返排速度对支撑剂回流量及其在裂缝内分布的影响
摘要:
根据压裂过程中压裂液返排时裂缝内支撑剂的运动特性建立了数学模型,模拟了裂缝内压裂液返排及支撑剂的回流过程,通过模拟计算发现压裂液的返排速度对支撑剂的回流量及支撑剂在裂缝内的分布影响很大。随着压裂液返排速度的增大,支撑剂的回流量逐渐增加,但增加的幅度逐渐变缓;支撑剂在裂缝内的分布状况则随着压裂液返排速度的增大而逐渐变好.计算结果表明,为了获得较好的支撑剂缝内分布,在施工条件许可的范围内应尽量提高压裂液的返排速度,既可改善支撑剂在裂缝内的分布,又减少了压裂液对地层的伤害
正文部分:
油气井压裂结束后,均有压裂后排液的过程,返排速度对支撑剂的回流量以及支撑剂在裂缝内的分布状况影响很大。返排速度过快会导致出砂,井底沉砂堆积掩埋油气层,或出砂冲蚀损坏地面测试管线,影响测试和油气开采工作的顺利进行。因此,掌握压裂后排液的控砂技术是油气井压裂的重要环节。但以往的研究多是关于支撑剂方面的,如采用包胶支撑剂,在支撑剂中加入热塑性薄膜或纤维等。而在返液过程中支撑剂悬浮在裂缝内,在压裂液滞带和自由沉降的共同作用下运动,因此压裂液的返排速度对支撑剂在裂缝内的分布状态有着重要的影响。笔者针对裂缝内压裂液和支撑剂的流动特性建立了数学模型,通过计算得到支撑剂回流量以及支撑剂在裂缝内分布状态与压裂液返排速度的关系。
假设条件为:①所研究的裂缝为垂直缝,裂缝为规则的矩形;②停泵时的缝宽为携砂液的体积除以裂缝面积,支撑剂在裂缝内均匀分布;③裂缝闭合时的缝宽为支撑剂的体积除以裂缝面积;④压裂后采用强制闭合技术;⑤返排时裂缝内的支撑剂在压裂液滞带和自由沉降的共同作用下运动,裂缝内压裂液向缝口流动,地层内流体不进入裂缝中。裂缝内支撑剂在垂向上做自由沉降运动,水平方向上受压裂液的滞带作用而运动,为此,分别对其在2个方向上的运动进行计算,从而得到支撑剂在裂缝内的运动规律。
结论:
增大压裂液返排速度会导致支撑剂的回流量增加, 但其增加幅度逐渐变缓。当压裂液返排速度较低时,裂缝内支撑剂的分布状况很差,在裂缝的底部支撑剂的厚度很大,但由于上部裂缝没有充填支撑剂,大部分已经完全闭合, 因此这一部分裂缝没有任何增产作用.随着压裂液返排速度的增大, 裂缝内支撑剂的分布状况逐渐变好;当压裂液返排速度达到9m3/min时,压开的裂缝已大部分被支撑起来。综合考虑支撑剂的回流量、支撑剂在裂缝内的分布状况以及压裂液对地层的伤害等因素,应在施工条件许可的范围内尽量增大压裂液的返排速度,以增加压裂后的产量。
文章二
中国致密油勘探进展及面临的挑战
摘 要:中国致密油勘探开发起步较晚,综合分析判断致密油是非常规油气资源现实的勘探开发领域。近3年,中国石油持续推进致密油勘探开发理论研究与生产实践,坚持搞清资源、准备技术、突破重点、稳步推进的致密油基本定位,取得了在鄂尔多斯、准噶尔和松辽等六大盆地形成了3个超亿吨级规模储量区、获得6项新发现和新苗头的一批成果,创新完善了以致密油甜点区预测和提高单井产量为目标的地震预测、测井评价、水平井钻探和体积压裂4项关键配套技术,初步形成了2项中国陆相致密油成藏理论认识等勘探开发、理论认识与技术创新方面的重要进展。但是我国致密油发展总体处于起步和探索阶段,分析认为主要面临如何深化理论认识、实现关键技术突破、实现效益开发与降低成本等4方面的挑战。基于我国陆相致密油地质条件复杂、起步晚的实际情况,提出建议国家加大政策扶持力度,以及重点做好加强研究、注重应用,加强攻关、完善技术,加强探索、突出发现,控制成本、提高效益等4方面的工作建议,对加快中国致密油发展、保障国家油气能源安全具有重要意义。
关键词:中国致密油;勘探开发成果;理论认识;配套技术;面临挑战;工作建议 结论:
我国致密油勘探开发虽然刚起步,但已经取得了一批重要的勘探开发成果,初步形成了3个超亿吨级规模储量区、获得6项新发现和新苗头,实践证实我国致密油具有广阔的发展前景,揭示了我国陆相致密油具有六大基本特征,初步形成了四大要素控制致密油形成及分布等2项成藏理论认识,以及创新完善了以致密油甜点区预测和提高单井产量为目标的地震预测、测井评价、水平井钻探和体积压裂4项关键配套技术。同时,也深刻地认识到目前我国致密油发展面临着理论认识创新、关键技术突破、实现效益开发与降低成本等诸多挑战。
Article 1
The influence of flowbackvelocity on the proppant backflow volume and distribution in the fracture
Abstract:
According to the movement of the proppant during the flowback,we build a mathematical model. The model simulated the process of fracturing fluid flowback and proppant backflow. As follows from the simulation, the flowback velocity of the fracturing fluid has a big influence on the proppant backflow volume and the proppant distribution in the fracture. With the increase of the fracturing fluid flowback velocity,the proppant flowback volume increases gradually. But the increasing extent decreases gradually. However, the proppant distribution becomes better with the increase of the fracturing fluid flowback velocity. According to the numerical simulation results, the flowback velocity should be increased for getting a better proppant distributionunder the permission of the construction condition. Not only can improve the proppant distribution, and reduce the formation damage of fracturing fluid.
After finishing the fracturing project, the fracturing fluid flowbackisnecessary. The flowback velocity of the fracturing fluid has a big influence on the proppant backflow volume and the proppant distribution in the fracture.Flowbacktoo quickly will cause sand production. Then, the sand will pile up at the bottom of the well and burry the reservoir. Alternatively,the sand will erosion the experimental pipeline on the ground and has a bad influence on testing and production. Therefore, it is very important to grasp the flowback sand control technique. However,numerous studies had been focused on proppant such as encapsulation proppant. The proppant suspends in fractures during the flowback, and moves with the fluid drag and sedimentation effect. Therefore, the flowback velocity of the fracturing fluid has a big influence on the proppant backflow volume and the proppant distribution in the fracture. According to the movement of the proppant during the flowback,we build a mathematical model. As follows from the simulation, we figure out the relevance between the proppant distribution in the fracture and the flowback velocity.
Assumptions:1.The fractureswhat we studied are vertical fractures.2.The fracture width when the pump stop is the sand carrying fluid volume divided by the fracture area. Proppant distribute evenly in the fractures.3.The fracture width when the fracture closeis the proppant volume divided by the fracture area.4.Using the forced closure technique after fracturing.5. During the flowback, the proppant moves with the fluid drag and sedimentation effect. In the fracture, fracture fluid flow to the fracture vent. And the formation fluid does not flow into the fracture. In the fracture, the proppant has a sedimentation movement in vertical direction and a movement with the fluid
frag effect. Therefore, we find the proppant movement law in the fractures by calculating the proppant movement in two directions respectively.
Conclusion:
With the increase of the fracturing fluid flowback velocity, the proppant flowback volume increases gradually. But the increasing extent decreases gradually. When the flowback velocity is low, the proppant has a bad distribution in the fracture. The proppant have a huge thicknessat the bottom of the fracture. However,most of thefractures completely close without filling the upper part of the fractures by proppant. Therefore, this part of fractures have no effect. With the increase of the flowback velocity, the proppant distribution becomes better. When the flowback velocity is 9m3/min, most of the fractured fracture have been propped up. Considering the proppant backflow volume, the proppant distribution in fractures and the formation damage, the flowback velocity should be increased under the permission of the construction condition for increasing the capacity after fracturing.
Article 2
Progress in China’s Tight Oil Exploration and Challenges
Abstract:
China was late in tight oil exploration and development. Based on comprehensive analysis, tight oil is the realistic exploration anddevelopment field of non-conventional oil and gas resources. In recent three years, PetroChina has made tenacious efforts for the theoretical study of tight oil exploration and development and clarification of the resources, prepared for technological breakthrough and positioned tightoil exploration and development. As a result, the company has established three zones, each with the reserves exceeding 100 million tons, andsix new discoveries in the six main basins like Erdos Basin, Junggar Basin and Songliao Basin. PetroChina has also created and improved fourkey technological families for prediction of the tight oil sweet-point zones as well as seismic prediction and logging evaluation targeted atimprovement of single-well production, and developed two initial theories on China’s onshore tight oil accumulations. However, China’s tightoil development is still under the preliminary stage. The analysis shows there are four challenges, such as how to enhance theoretical study,how to make breakthrough in key technology, how to bring about high-efficiency development, and how to reduce the cost. Thanks to China’scomplicated onshore tight oil geological conditions, it is proposed that the State formulate more preferential policies to support this industrywhile focusing efforts for technological study and application, highlighting the discoveries, reducing the cost and improving the economicperformance. Those suggestions are of great significance to acceleration of China’s tight oil development and the security of the country’s oiland gas supply.
Key Words: China’s tight oil, exploration and development results, theoretical study, systematic technology, challenges, suggestions
Conclusion:
China was late in tight oil exploration and development. But a number of important exploration and development results have been founded. Three zones, each with the reserves exceeding 100 million tons, andsix new discoveries have been established. Thepractice showsthat tight oil in China has broad prospects for development. It also shows that tight oil has six basic characteristics of continental facies.Two initial theories four factors controlling the formation and distribution of tight oil have been developed. Furthermore, China has also created and improved four technological families for prediction of the tight oil sweet-point zones as well as seismic prediction and logging evaluation targeted atimprovement of single-well production. Meanwhile, we keenly aware of the current tight oil development is faced with theoretical understanding of innovation, breakthroughs in key technologies, achievement of efficiency development and reduction of costs, and many other challenges.