雅思写作Task1柱状图考官范文(1)
这是一篇雅思写作Task1柱状图考官范文,供大家参考。认真研读一定的雅思范文及作文模板可以帮助我们检验自己的写作水平,并能很好地吸收和应用优秀范文里的优秀内容。
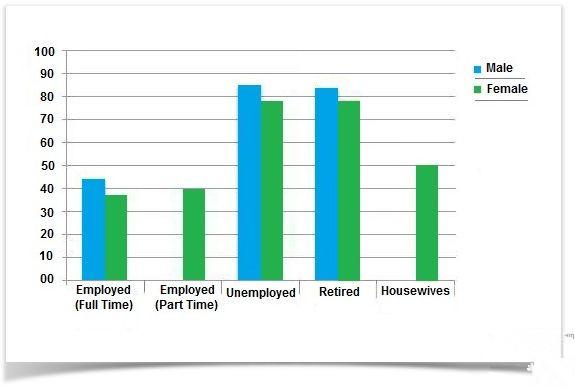
The chart below shows the amount of leisure time enjoyed by men and women of different employment status.
Write a report for a university lecturer describing the information shown below.
Leisure time in a typical week in hour: by sex and employment status, 1998-99.
Model Answer:
The provided chart shows the number of leisure hours enjoyed by men and women in a typical week in 1998-99, according to gender and employment status. As is observed from the graph, the unemployed and retired men and women had more leisure time than the other type of people.
Among the full time employed people, men had about 45 hours of leisure time on an average per week compared to the 38 hours of leisure time for woman. No data is given for the part-time employed men and woman from this category enjoyed 40 hours of leisure time in a week. This figure is slightly more than the employed woman perhaps because of their employment nature.
Unemployed and retired people had the longest period for leisure activity both for men and woman and men had a bit more hours than the women. As expected the retired and unemployed people enjoyed about 78 to 82 hours per week which is longer than people from other employment status. Lastly housewives enjoyed approximately 50 hours of leisure time which is more than the employed woman but less than the unemployed and retired woman. The graph reflects that men had more leisure time from all status than woman which indicates that woman spent on more time working at home than the male.
The graph summarises that the male enjoy more leisure time than woman and employed people had less time for leisure activity than retired and unemployed people.
(Approximately 244 words)
Alternative Answer:
The graph compares the amount of leisure time enjoyed by people of different employment level s in a typical week in the year 1998-1999.
In the given column graph, no data has been provided for the part-time employed and house-staying men. For rest of the cases, Men have more leisure time than women of the same category. The highest amount of leisure hours are enjoyed by those, who are unemployed. Unemployed men had approximately 85 hours of spare time and women from the same category had about 83 hours. The retired people also enjoyed the same amount of leisure activities as did the unemployed men and women. On the contrary, full-time employed men had a total of 40 hours leisure time compared to about 37 hours of women from the same status. Finally woman with part-time job had 40 hours-time to spend as leisure time and Housewives had 50 hours leisure time.
In conclusion, unemployed and retire people, both men and women enjoyed more leisure time than employed people and men compared to women had more time for leisure activities.
第二篇:雅思写作Task1图表作文写作方法
雅思写作Task1图表作文写作方法
寫作測驗第一部份:描述圖表資訊
第一部份寫作測驗的目的是要評量考生是不是有描述圖表、圖形或表格等不同資料形式的能力。在英國,大部分大學以上的學生必須寫這樣的文章,所以對一個將到英國唸書的學生來說,是一個必備的能力。
第一 : 瞭解圖形資訊
下筆之前,第一要瞭解圖表中的資料,第二要構思怎麼回答問題和如何分段組織。
第二 : 瞭解圖表中的資料
第一要找圖表或表格旁的標題或主題, 如此可以大概了解圖形的內容。第二要找出圖形中各項資料的關係,大部分的數據資料會用來顯示兩組或更多組資料之間的關係。通常,這些資訊會寫在標題欄和標題列上。第三找出資料的特徵和趨勢,例如 20##年到20##年,越來越少小孩被生出來之類的資訊走向。
第三 : 組織和構思文章
寫文章時一定要根據自己的想法組織仔細分段,而第一段通常是引言,可以描述一下圖表的基本資訊,說明將要描述的資料, 然後做評論。本文的部分,要分幾段來描述圖表上的資訊。最後一部分是結論,要將所描述的資料做總結並且解釋發現到的趨勢。有時候,題目會要求對形成趨勢的原因或理由作評論,而不錯的結論可能會有加分效果。
数据图表:a data graph图表, 曲线图/chart/diagram图解, 简图, 图表,示意图/illustration说明, 图解, 图示/table
饼图:pie chart
表格图:table
直方图或柱形图:bar chart / histogram柱状图
趋势曲线图:line chart / curve diagram 曲线统计图
流程图或过程图:flow chart / sequence diagram
程序图:processing/procedures diagram
圆柱图:column chart
描述:show/describe/illustrate/apparent/reveal/represent/demonstrate/indicate/depict
以下是一些较常用的描述用法
The table/chart diagram/graph shows (that)
According to the table/chart diagram/graph
As (is) shown in the table/chart diagram/graph
As can be seen from the table/chart/diagram/graph/figures,
figures figures/statistics统计资料 shows (that)...
It can be seen from the figures/statistics
We can see from the figures/statistics
It is clear from the figures/statistics
It is apparent from the figures/statistics
table/chart/diagram/graph figures (that)
Para1. This is a table / chart / (line线状 bar柱状 pie饼状)graph which demonstrate / illustrate / reveal /depict /privide information about.............
Para2.
(1)Obvious明显的; 显而易见的; 显然的/Apparent显然的, 明白的, 清晰可见的from the graph is that ...rank the first/highest, while/whereas但是, 然而,尽管....turn out to be the lowest最低的,最底下的,最小的
(2)It is exhibited显示出/shown in the table that.....
(3)It can be seen from the table that.....
Para3.
(1)饼.柱图 A,which accounts for...%,ranks the first居世界第一; then next is B with...%;followed by接着是C, constituting构成...%;finally最后it comes D.E.F at...%...%and...%respectively分别;各自;顺序为;依次为
(2)特殊变化(不变,增长或下降多的)
①It is worth mentioning值得一提that....
②It must be pointed out必须指出……that....
③More striking更令人吃惊is that....
Para4.To conclude总而言之/In conclusion最后, 综上所述/overall大体上, 总的来说
雅思图表作文6分范文实例解析
WRITING TASK 1
You should spend about 20 minutes on this task.
The graph below gives information about cinema attendance in Australia between 1990 and the present, with projections to 2010.
Summaries the information by selecting and reporting the main features, and make comparisons where relevant.
Write at least 150 words.
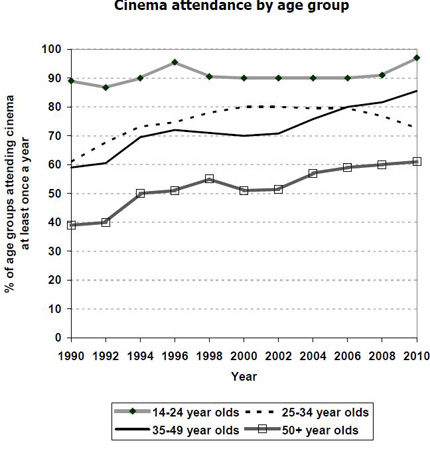
The graph shows percentages of cinema attendance at least once a year in Australia between 1990 to 20## with projections for the future. The graph is described by 4 groups of different ages which are 14 to 24, 25 to 34, 35 to 49 and over 50 year olds.
The youngest age group people have been going to cinema more than any other age groups and the percentage has been keeping very high at approximately90% since 1990. It is predicted to keep the high and to increase more from 2006.
The middle age groups’ people have enjoyed going cinema between 60% to 80%. The percentage of age 25 to 34 groups has been higher than the one of age 35 to 49 group but from 20## the percentage of 25 to 34 year olds people will decrease while the one of 35 to 49 year olds people will increase and get higher than the other one.
The oldest people seem to go cinema less than the other groups but the percentage of the attendance has slightly going up by 15% from 40% to 55% between 1990 to 20## and it will keep increasing to 60% by 2010.
Overall, it seems the younger age people, the more going to cinema.
【考官评语】
Band 6
This response addresses the requirements of the task and selects relevant material to describe. Key features and an overview are presented, although clearer highlighting, more support and a more comprehensive overview would be needed to reach a higher band. Information is well-organized and there is a clear overall progression in the response. There is some effective use of cohesive devices, but only limited use of reference and substitution. The range of vocabulary is not wide, but it is adequate for the task. Control of word form and spelling is consistently good, although there are some clumsy noun phrases that indicate limited flexibility. The candidate attempts to use a mix of simple and complex sentences, but control is variable and grammatical errors or omissions are quite intrusive at times. Figures are poorly integrated into sentences and indicate evident limitations.
【世纪雅思 0607 + 写作】雅思八分经典作文背诵:图表范文写作
柱状图显示的是1970-1990二十年间英国人每周在快餐上花费了多少钱;曲线图展示的是这二十年间快餐消费的趋势。
The bar chart shows how much money was spent on fast foods per week in the UK over a span of 20 years from 1970 to 1990 while the graph reveals the trend of fast food consumption over the same period of time.
从柱状图看,各收入阶层在汉堡和鱼煎薯条这两种快餐上的支出相对高于在皮萨上的消费;曲线图反映出汉堡与皮萨的消费呈现上升趋势,鱼煎薯条则呈现出波动趋势。
As we can see from the chart, the weekly expenses of people of different income levels on hamburgers and fish and chips were relatively higher than that on pizza. The graph indicates that while hamburger and pizza consumption both revealed a general trend of increase, fish and chips showed a trend of fluctuation.
首先,高收入阶层和中等收入阶层每周在汉堡上的平均消费分别是每人42便士和33便士,比低收入阶层的14便士搞出了很多。在鱼煎薯条方面,高收入阶层的支出略低,是17便士,但中等及低收入阶层的支出都分别达到了25便士和18便士,相对于在皮萨方面支出的12便士和8便士高出了很多。值得一提的是高收入阶层在皮萨上的消费高于鱼煎薯条2便士,为20便士。
First, the weekly average expenses of high-income people and middle-income people were 42 pence and 33 pence respectively, a lot higher than that of low-income people which was 14 pence. As for fish and chips, high-income people spent relatively less, only 17 pence, but the expenses of middle-income and low-income groups reached 25 pence and 18 pence, much higher than their expenses on pizza which stood at 12 pence and 8 pence respectively. What is worth mentioning is the amount of money spent on pizza by high-income people which showed only 20 pence, 2 pence more than their expense on fish and chips.
第二,从1970年的每周平均85克开始,人们在汉堡上的消费缓步增长到了1975年的100克,然后,消费量加大增速,到1983年左右已经达到了200多克。接下来,我们看到的是更强势的增长,到1990年达到了图表上的最高峰550克。
Second, starting from averagely 85 grams per week in 1970, people’s consumption of hamburgers gradually grew to 100 grams in 1975 and was then followed by a faster growth, reaching more than 200 grams in around 1983. From then on, the growth gained a stronger momentum, hitting the peak across the board at 550 grams in 1990.
第三,皮萨的消费趋势与汉堡相仿,也是很明显的三个增长阶段,但是增幅没有汉堡那么大。1970年至1980年,皮萨的消费从平均每周40克慢慢增长到80克;1980年至1985年,增长加快,从80克增加到了130克;1985年至1990年,增幅加大,从130克快速增长到了280克。
Third, the consumption of pizza revealed a similar trend of growth as that of hamburgers and could also be clearly cut into three periods, though the growth rate was not that fast. It rose slowly from 40 grams per week in 1970 to 80 grams in 1980 and then grew faster from 80 grams in 1980 to 130 grams in 1985. From 1985, the growth rate was even faster and we see a big increase from 130 grams to 280 grams.
第四,鱼煎薯条的消费趋势在波动中呈现了三种状态。1970年至1975年一直是缓慢的下降,从平均每周300克降至280克;之后,从1975年至1985年,下降速度稍有加快,从280克降至200克;自此,开始逐渐回升,到1990年攀升到了240克。
Fourth, the consumption of fish and chips showed three changes in the general trend of fluctuation. From 1970 to 1975, it dropped slowly from the original 300 grams per week in 1970 to 280 grams in 1975. Later on, from 1975 to 1985, it dropped a little bit faster when it fell from 280 grams to 200 grams. From then on, it began to rise gradually and till 1990, it had climbed back to 240 grams.
总之,英国人在上述所提及的三种快餐方面的消费在图表所标识的二十年里都发生了或增或降的某些变化。
To sum up, the consumption of the three above mentioned fast foods in Britain showed certain rises and falls as illustrated in the chart and graph over the designated 20 years.