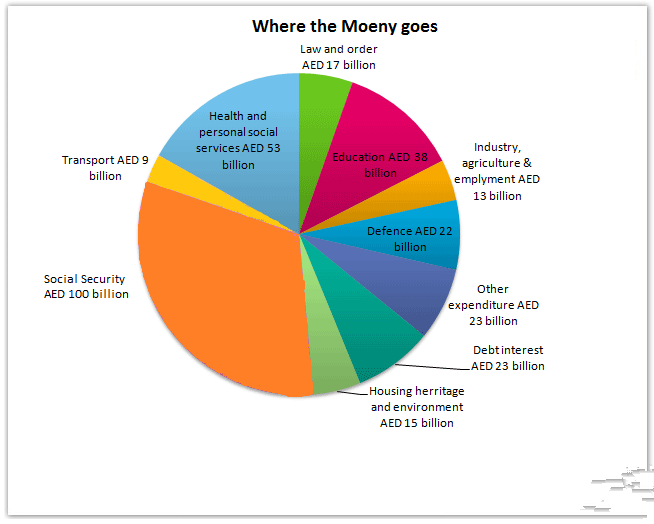
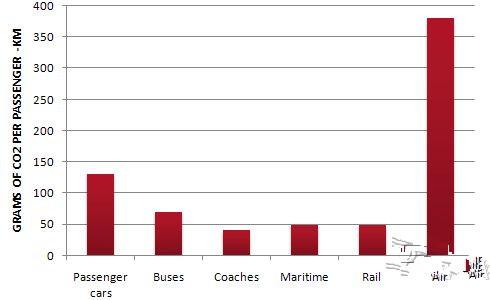
雅思写作Task1饼状图考官范文(3)
本文为大家收集整理了雅思写作Task1饼状图考官范文(3)。认真研读一定的雅思范文及作文模板可以帮助我们检验自己的写作水平,并能很好地吸收和应用优秀范文里的优秀内容。
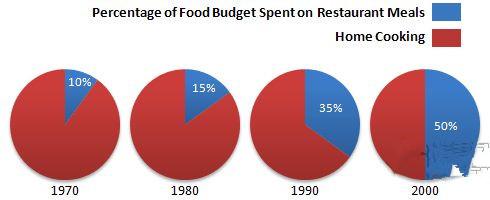
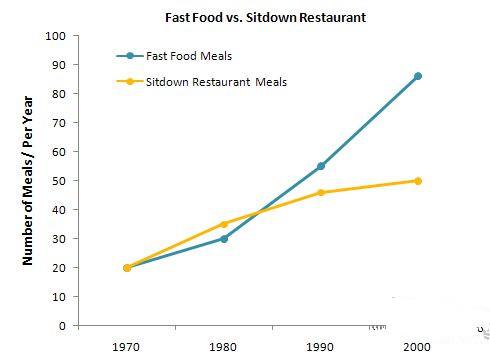
The charts below show the percentage of food budget the average family spent on restaurant meals in different years. The graph shows the number of meals eaten in fast food restaurants and sit-down restaurants.
Write a report for a university lecturer describing the information in the graph below.
Sample Answer:
The given illustration compares the amounts spent on restaurant foods and on home cooking foods in four different years and gives data on the number of meals eaten in two different restaurant types.
As is presented in the pie chart, initially in 1970, 90% of total food budget was spent on home-made foods while only 10% was spent on restaurant foods. The amount spent on restaurant meals increased to 15% in 1980 while it reached to 35% in 1990. Finally in 200 average family spent half of the total budget in restaurant meals and that shows a rapid increase on the people’s habit of having meals in restaurants.
…… …… 余下全文