Physical Lab Report : Measurement of Liquid Viscosity
Writer: No.
Experiment 1: using falling ball method
Experiment 2: using comparative method
ⅠGoal of the experiment
1.Get familiar with basic tools to measure length,time,weight,etc.
2.Through the measurement of viscosity,learn principles about uncertainty evaluation.
Ⅱ Principle of the experiment
Experiment 1
G.G.Stokes derived the frictional force as  .
.
When the ball move with a constant speed v,the frictional force ,the buoyant force,and gravity reach the equilibrium,so we have:
 (1)
(1)
Therefore ,the viscosity can be measured by measuring the constant velocity via:  (2)
(2)
However,we estimate the complicated one to be simper:
 , (3)
, (3)
Where  is the density of the liquid and
  is the density of the ball.
Since  ,so the final formula is :
  (4)
(4)
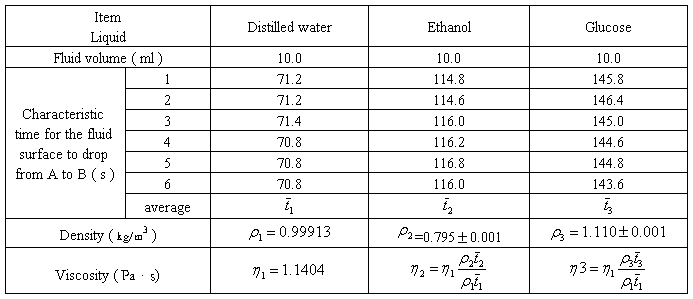
Experiment 2
Use comparative method, ,where is the density of water, is the density of the liquid,
  is the time required for water surface to drop from A to B,
  is the time for the liquid.
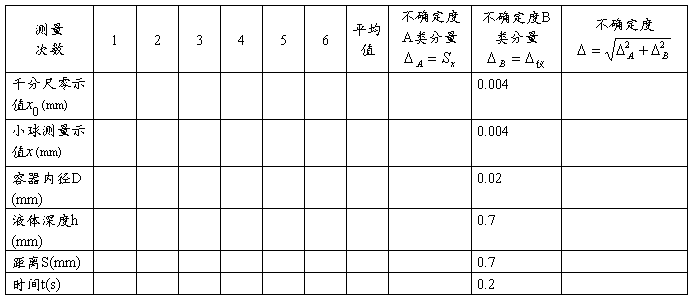
Ⅲ Measurements
Experiment 1According to the formula,we have to measure the distance between two laser beams s, the time t, the diameter of the ball d , the diameter of the cylinder D, the density of the liquid  and the mass of a ball m.
Experiment 2 Keep the volume constant, we need to measure the density of water,ethanol,and glucose;the time they need for the surface drop from A to B.
Ⅳ Experimental data and analysis
Experiment 1
A.measurement of s
At first, I adjusted the base plate , and marked the laser spots on the wire.then I measured the distance between two spots on the wire with a ruler 10 times.

Then,I use MATLAB to get the 
B.measurement of D
Secondly,I used the caliper to measure the inner diameter of the cylinder for 10 times.
Then,I use MATLAB to get the  .
.
C.measurement of t
Thirdly,I placed a ball into the guide .When the ball crosses the upper laser light,I start the stop watch;when it crosses the lower laser light,I stop the stop watch.

Then,I use MATLAB to get the  .
.
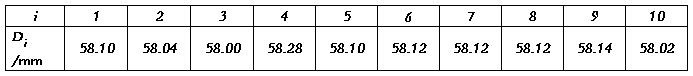
D.measurement of d
Fourthly,I used the micrometer to measure the diameter of the steel ball

Then,I use MATLAB to get the  .
.
E.measurement of mass of the ball
I make a linear fit of mass vs N to get the mass of a ball
The experimental data is :

And I made a fit linear:
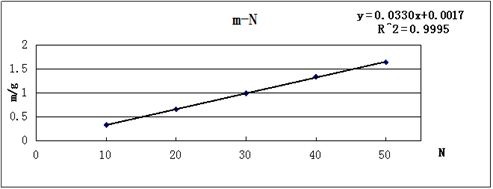
From the graph and MTLAB,I get  .
.
F.measurement of 
I use the liquid density meter to read the density of the sesame oil.

G.Environmental record T=21.5℃
Experiment 2 (T=15℃)
Ⅴ Conclusion and error analysis
Experiment 1
According to (4),we have :

Put the results above into (5),I got the result:

Hence,we have:

I use MATLAB to get:
besides,we already have 
Put them into (6),immediately,I got the error:

Hence, T=21.5℃
Experiment 2
 ,
,  ,
,  ( s )
( s )
 with MATLAB,I know:

Hence,  T=15.0℃
Similarly,we have the result  T=15.0℃
Ⅵ Discussion and error analysis
Experiment 1
1.In the equation, ,we omit the corrections of the order of r/h,which makes our result a littler lager than the exact one.
2.The principle of the Liquid density meter:It is based on the condition that the buoyant force is equal to the gravity .Where
 .Different liquid has different density,so the meter has different height h.So,in different liquid,the height overwhelmed in liquid is different,resulting that we can read different density,
3.Errors:
?Maybe there are some bubbles in the liquid,which will make the final result lager.
?Though I have make efforts to let the ball fall from the center,the steel ball still may not fall along the direct line from the center.
?The temperature is changing during my experiment,which has a great influence on the final result.Although I have read the temperature twice,there must be errors.
Experiment 2
1.The volume of the liquid input to the viscometer has to be a constant because we use the comparative method. In this method,we only use the equation , which has omit the volume V, so we have to keep the volume a constant,otherwise, this equation is meaningless.
2.Errors:
?There are several small bubbles in the liquid,which has an influence on the final result.
?It’s subjective to judge the viscometer to be vertical by eyes.
?When we change the liquid, there is a small amount of water in the tube which hasn’t been washed.It will has a influence on the following measurement of another liquid.
第二篇:实验十 液体粘滞系数的测量
实验十 液体粘滞系数的测量
1、小球要在液面上中央位置释放,让其自由下落。
2、用秒表测量出小钢球通过上下标线时所用的时间,上标线距液面的距离要多于5cm,小球通过标线时,要使视线水平。
3、要小心操作,避免打破玻璃圆筒或把蓖麻油滴在桌面上。
4、练习2-3次再正式测量。
5、数据记录表格:
 ;
; ;
; 
6、数据处理
小球直径测量值 = ;
= ; = ;
= ;
 = ;
= ;
 = ;
= ;
 = ;
= ; = ;
= ;
 = ;
= ; = ;
= ;
 = ;
= ; = ;
= ;
 = ;测量结果: