图表式作文模板
图表式作文写作要求学生通过对数据和文字内容进行分析与讨论,系统准确地表达内容,并得出令人心服的结论。 图表式作文有以下几种形式:一是以表格形式,将统计的数据或被说明的事物直接用表格形式体现出来,即统计表。二是以图形形式,可分为以曲线形式表示数据变化的线形图;以条形方式表示数据的大小或数量之间的差异的条形图;以圆内扇形的大小表示总体内部结构变化的圆形图。 图表式作文写作分三步:
第一、开门见山地点明本图表所反映的主题 经常使用的词汇有:table, chart, figure, graph, describe, tell, show, represent等等。
第二、分析数据间的主要差异及趋势,然后描写 在描写数据间变化及总趋势特征时,可采用分类式或对比式以支持主题,并阐明必要的理由。要注意层次清楚。经常使用的词汇有:rise, drop, reduce, increase, decrease, fall, while, but, on the contrary, however, compare... to/ with..., in contrast to, as...as, the same as, similar to, different from, difference between, among, more than, less than等等。
第三、归纳总结或发表评论。 经常使用的词汇有:in a word, in short, generally speaking, It's clear from the chart that..., We can draw the conclusion that..., We can learn/know...等等。
【例析1】请你根据下表提供的信息写一篇题为Changes in Chinese People's Diet的短文,短文可分为三小节:
1)state the changes in people's diet in the past five years; 2)give possible reasons for the changes; 3)draw your own conclusions.
注意:1. 尽可能少引用数据; 2. 词数100左右。
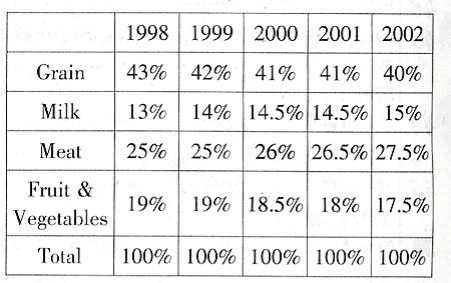
分析:本统计表描述中国人民从1998年至20##年饮食结构的变化。
第一步:点明主题。
There have been some changes in the diet of the Chinese people.
第二步:观察图表中数据的增减总趋势,分类式阐明,并说明原因。
Grain, the main food of the most people in China, is now playing a less important role. The amount of fruit and vegetables in the average person's diet has also dropped by 1.5 percent from 1998 to 2002. The amount of milk and meat has increased.
The changes in diet can be explained by several reasons. For one thing, with the development of the economy, people can afford to buy better foods. For another, people have realized the importance of a balanced diet.
第三步:归纳总结并得出结论。
In a word, the changes are the signs of the improvement in people's lives. There is no doubt that there will be greater changes in people's diet in the future.
【例析2】根据下面所给两幅图,完成100词左右的一篇短文(首句已给出)。参考词汇: expenses: n. 支出,费用

The Average Family Expenses
The average family income in the U. S. has increased.______________________
分析:
第一步:点明本圆形图所表明的主题。
The average family income in the U.S. has increased. The way the average family spends its income has also changed.
第二步:描述两个圆形内数据间的变化。
In 1997, 25% of the income was spent on housing and 18% on food and drink. 57% was used to meet all other expenses. In 2002, 32% was spent on housing, a big increase. Food and drink consumed 22%. The remaining expenses amount to 46%.
第三步:总结。
It's clear from the charts that as incomes increase people can afford to live more comfortably and eat more.
激活练习: 根据所给图表,写一篇题为"电影与电视"的短文。短文须包括以下要求:
A. 电影观众人数呈逐年下降趋势; B. 电视观众人数越来越多(原因:方便、经济、选择范围); C. 然而还是有人喜欢看电影(原因:气氛、娱乐)。
注意:(1)短文须包括主要内容,可适当增减,使内容连贯; (2)词数100左右; (3)开头语已写好。(注:下面参考范文的划线部分即是给出的开头语。)
参考词汇: decrease v. 下降 atmosphere n. 氛围 entertainment n. 娱乐 film goer/TV watcher电影/电视观众

[(a):Number of TV watchers (b):Number of film goers]
一、图表作文写作常识
泛指一份数据图表:a data graph/chart/diagram/illustration/table饼图:pie chart直方图或柱形图:bar chart 趋势曲线图:line chart / curve diagram表格图:table流程图或过程图:flow chart 程序图:processing/procedures diagram
二、相关常用词组
significant changes 图中一些较大变化noticeable trend 明显趋势during the same period 在同一时期grow/grew 增长distribute 分布,区别unequally 不相等地in the case of 在……的情况下in terms of / in respect of / regarding 在……方面in contrast 相反,大不相同government policy 政府政策market forces 市场规率measure n.尺寸,方法,措施v.估量,调节forecast n.先见,预见v.预测
三、图表作文的框架
As is shown/indicated/illustrated by the figure/percentage in the table(graph/picture/pie/chart), ___作文题目的议题_____ has been on rise/ decrease (goes up/increases/drops/decreases),significantly/dramatically/steadily rising/decreasing from______ in _______ to ______ in _____. From the sharp/marked decline/ rise in the chart, it goes without saying that ________.
There are at least two good reasons accounting for ______. On the one hand, ________. On the other hand, _______ is due to the fact that ________. In addition, ________ is responsible for _______. Maybe there are some other reasons to show ________. But it is generally believed that the above mentioned reasons are commonly convincing.
As far as I am concerned, I hold the point of view that _______. I am sure my opinion is both sound and well-grounded.
第二篇:作文模板-图表作文