书面表达讲解与训练——图表类写作
一. 教学内容:
书面表达讲解与训练——图表类写作
[如何写图表作文]
图表作文多以说明文和议论文为主,要求考生根据所给的图表、数据及标题进行分析、研究,阅读其中的文字和说明,弄清各种信息之间的关系,提炼和确定出文章的中心思想。
然后进行分析、概括和归纳。注意:1)图表和数据内容不必全部描述。2)善于抓住总的规律,趋势,归纳增减率。 3)时态:特定时间用过去时。经常出现的情况或自己的评述用一般现在时。
[图表作文形式有]
数字表:曲线图(line graph) 表格 (table)
图形表:饼状图(pie chart) 条状图(bar chart)
[常见的表达用语]
短语:
上升
go up to/ climb to/ increase to/ rise to/jump to
The population of this city has been increasing so rapidly that it has now amounted to 250 million.
There was a rapid increase between 1993 and 1994, and the number then jumped to five million in 1995.
保持没变
remain; not change
The number of fires in each month remained the same.
下降
fall to; go down to; decrease; drop to; decline;
In comparison with that in 1988, the percentage of peak points decreased by 30%.
The number of South American travelers increased slightly and the number of visitors from Europe declined slightly.
句式:
The table shows (indicates) that a great number of people spent their holidays traveling abroad.
As we can see from the graph that the rate dropped slightly from 38% in 1993 to 31% in 2003.…
From the table we can find out that only 35% of the people have taken in physical activities.…
According to Chart I,the number was ten times as many as in 1995.
Compared with the boys, the girls show more interested in chatting.
The number of the boys playing games is much larger than that of the girls.
...is equal to that of...
It doubled the number of last year.
结束语
As can be seen from the chart that, only 10% of the time is taken up with sports activities.…
As is shown in the chart, the production last month rose so significantly…
As is described in the chart, the total number of visitors to the United States had nearly doubled to 2.7 million person by 1974.
After giving a careful consideration to the problem, I think I will be able to select the one who best fits the position.
It is clear from the chart that as incomes increase people can afford to live more comfortably and eat well.
Therefore, we need to educate our children, warning them of the dangers of playing with matches.
In conclusion, the upward trends suggest that more and more computer users will have access to Internet in the future.
In summary, smoking increased three different times and declined twice, with the last downward trend still continuing.
[常用连接词]
To move to the next major point: what’s more, in addition, besides, furthermore.
To contrast a point: on the contrary, on the other hand, nevertheless, however, yet.
To conclude a point: consequently, as a result, in other words, in short, accordingly.
To emphasize a point: without doubt, chiefly, as a matter of fact, in fact.
【典型例题】
[图表类作文分析与讲解]
例1. 20## 北京高考
某学校对中学生课余活动进行了调查,结果如下。请根据图表1提供的信息描述学生每天的课余活动,并针对图表2中任何一个数据中反映的情况写出你的一个看法。词数不少于60。
生词:图表chart
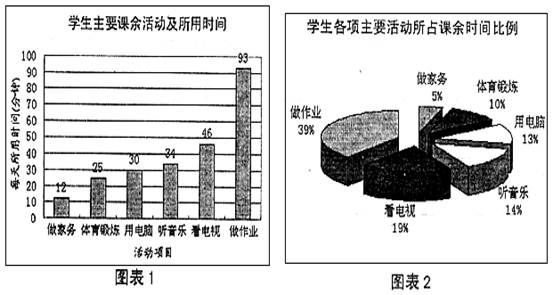
例文:Chart 1 shows the daily average amount of time the students of the school spend on different after-class activities. The students put the most time-93 minutes-into their homework, and next in line is watching TV, which takes up 46 minutes. They put in about the same amount of time listening to music and working on the computer, 34 minutes and 30 minutes each. While 25 minutes is spent on sports, only 12 minutes goes into housework.
As is shown on Chart 2, only 10% of the time is taken up with sports activities. I think the school should encourage the students to do more exercise after class. This way, they may be healthier and more energetic.
·对图表准确说明和表达信息的能力
·根据信息阐述个人观点的能力
·安排好要点和数据的表达,组织好文章的结构是完成这篇写作任务的要点
(以往的写作任务是要求学生根据图片或是文字信息来叙述内容,表达思想,属于记叙文体。 但这篇写作任务是说明和议论的结合。)
例2. 2001上海春招
某城市近年每百人中手机用户增长示意图
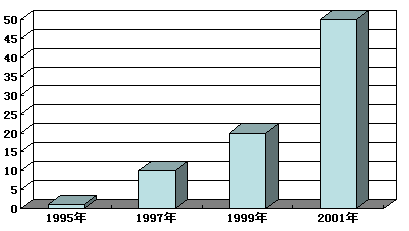
根据所给图表,简要描述某城市近年每百人中手机用户增长情况,并试分析其增长原因。
例文:More and more people have mobile phones in recent years. In 1995, only one person in a hundred had a mobile phone in some city, showed as the above diagram. In 1997, 10 persons in a hundred had mobile phones. The number of the people who had mobile phones was ten times as many as in 1995. In 1999, there were 20 persons who had mobile phones. In 2001, a half of the persons in a hundred had mobile phones.
There are several reasons for the increase of the number of people having mobile phones. First, the technology of making mobile phones is changing rapidly. Secondly, people’s income had been increasing quickly. Thirdly, mobile phones are useful in people’s life. They can communicate with others very conveniently.
[课堂练习]
1. 某对外发行的英文报纸对中国群众体育现状进行了调查,请根据下列图表和所给提示,用英语写一篇报道,向该报投稿。
参加体育活动的人口比例:

影响人们参加体育活动的客观原因:
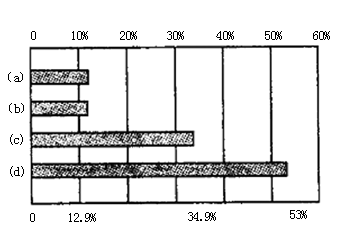
(a)不懂锻炼方法者 (b)场地远、不方便
(c)缺少场地设施 (d)缺少时间
针对以上状况作出说明:
①缺乏体育锻炼会使人们的体质下降;
②应充分认识体育锻炼的重要性;
③应采取措施,提供人们锻炼的场地和器材(facilities);
④词数:100 ~120;
例文:Recently we made a survey of the people on physical training. Only 35 percent of the surveyed people have taken part in physical activities, but the rest never have. There are many reasons for this.
Over half of the people say they haven't got enough time to do exercise. 34.9% of them complain that they don't have places where they can relax and that there are not enough training facilities. 12.9% of the people feel that they live too far away from the training centers. Some of them even don't know how to train.
Because of lack of physical training, many people are not in good health. People should realize the importance of it, and measures should be taken to provide people with more training facilities and places.
【模拟试题】
[写作练习]
1. 根据所绘表格,为某城市市报写一篇新闻报道,简要描述该市近年家用电脑用户增长情况,并分析其增长原因。主要原因为:电脑在各个领域的广泛使用;上网获取信息的方便,快捷;学校普遍开设电脑课程;近两年家庭收入增长等。
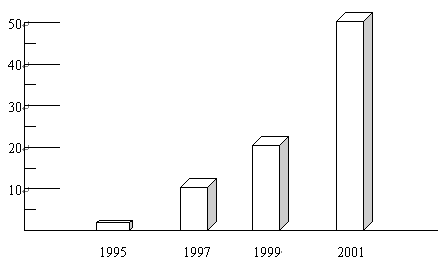
Recently the average number of personal computers in every 100 families has been increasing rapidly in our city . In 1995_________________________
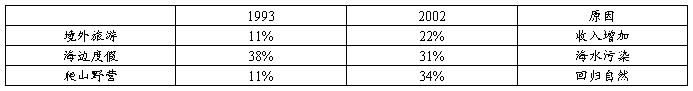
2. 下列表格为某城市1993年与20##年人们度假方式的情况比较, 请按表格内容对度假方式变化的原因进行简要的分析。
【试题答案】
[写作练习]
1. Recently the average number of personal computers in every 100 families has been increasing rapidly in our city. In 1995 there were only two or three computers in per hundred families. In 1997, 10% of families began to own computers, and 20% in 1999. With the wide use of computers in all kinds of fields and the increase of family income, 50% of the families have their own computers at home in 2001. Searching for information easily and conveniently on Internet and computer lessons taught in school are also the reasons why so many families have computers. It is believed that in the near future more and more people will buy computers for their own.
2. The way people spend their holidays changed a great deal from 1993 to 2002.
The table shows that a greater number of people spent their holidays traveling abroad, the rate of which in 20## doubled that in 1993. And we are sure the number will increase because more and more people can afford journeys.
The seaside still attracted people. Compared with 1993, the rate dropped slightly in 2002. But there might be a further decrease because of pollution. The polluted seaside would certainly drive visitors away.
Things about camping and climbing were almost the same. The rate of that grew by three times. The reason may be that the beauty of nature is striking people. They are eager to get closer to nature.