刚刚结束的12月21日雅思考试中,小作文考到了柱状图和饼状图,很多同学对于饼状图的写作并不是很有把握,让我们一起来看看上海环球雅思写作老师给出的小作文饼状图范文,希望能对20xx年准备考试的同学有所帮助。
Describing an IELTS Pie Chart
This lesson will provide you with tips and advice on how to write an IELTS pie chart for task one. To begin, take a look at the pie chart below and the model answer.
You should spend about 20 minutes on this task.
The pie charts show the main reasons for migration to and from the UK in 2007.
Summarize the information by selecting and reporting the main features and make comparisons where relevant.
Write at least 150 words
Sample Answer
The pie charts illustrate the primary reasons that people came to and left the UK in 2007.
At first glance it is clear that the main factor influencing this decision was employment.Having a definite job accounted for 30 per cent of immigration to the UK, and this figure was very similar for emigration, at 29%. A large number of people, 22%, also emigrated because they were looking for a job, though the proportion of people leaving the UK for this purpose was noticeably lower at less than a fifth. Another major factor influencing a move to the UK was for formal study, with over a quarter of people immigrating for this reason. However, interestingly, only a small minority, 4%, left for this.
The proportions of those moving to join a family member were quite similar for immigration and emigration, at 15% and 13% respectively. Although a significant number of people (32%) gave ‘other’ reasons or did not give a reason why they emigrated, this accounted for only 17% with regards to immigration.
第二篇:雅思小作文饼状图写作范例、思路、常用句式
雅思小作文: 饼状图一例
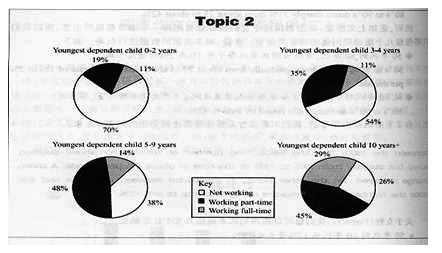
Many women want or need to continue working after they have children. The chart below shows the working after they have children. The chart below shows the working pattern of mothers with young children.
作文写作要点:
介绍各扇面及总体的关系。
各个扇面之间的比较,同类扇面在不同时间、不同地点的比较。
重点突出特点最明显的扇面:最大的、 最小的、互相成倍的。
The basic trends of the four charts:
Just after bearing children, back to work.
The older child…the more…
Most part-time during child 5~9
Child 10+, full time double, part-time less
the introduction can be written like this:
Even just after having a child, a large number women return to work. As the child grows older, the percentage of mothers who choose or need to continue working rises. At least until the child is ten, the larger number of working mothers take part-time occupations. When the child is ten years or older, the number of the full-timers more than doubles while that of the part-timers decrease.
Each chart entails / contains instruction, which illustrates what the chart involves rather than the over trends.
Writing Paragraphs:
Information analyzed according to the pie charts.
Child 0~2, 30% back to work (19p.t., 11f.t.)
3~4, p.t. up dramatically to 35%, f.t. same
5~9, p.t. up consistently to 48%, f.t. slight increase to 14%
10+, p.t. slightly 3% down, f.t. double to 29%
Paragraph 1:When the youngest child is at most 2 years old, 30% of the women return to work. 19% full-time, and 11% as part-timers.
Paragraph 2:The percentage of full timers remains the same until the child turns five and increased slightly to 14% when the child is at most 9 years old, but the percentage of part-time working mothers grows dramatically to 35 and continues growing to 48% by the time the child is 9.
Paragraph 3:A change occurs after the child grows to ten. The number of full-time working mothers doubles in percentage to 29, while that of the part-timers is reduced slightly to by 3% to 45%.
Conclusion:It appears that, when the child turns to ten, women have much fewer maternal responsibilities than the years before.
Sentence Patterns:
Introduction:
The (two) pie charts show (reveal, suggest, illustrate, demonstrate, indicate, describe, relate) the proportion (percentage) of A and B… in (7) (categories), divided into…and…(one is…, another is…)
Comparison:
1、The biggest difference between (2) groups is in …, where A makes up % while (whereas) B constitutes % (makes up=constitutes=accounts for)
the highest percentage / amount of A, which was approximately %, was for…. (=in) /was found in
2、The percentage of A in … is more than twice the percentage of B, the ration is % to % (% compared to %)
3、In…, while there is (not) a great deal of difference between the percentage of A and B (the former is % and the latter is %).
in …, while a greater percentage of A than B are found in… (the former is % and the latter is %).
4、There are more A (in …), reaching %, compared with % of B
5、By contrast, A has increased (declined), from % in …to % in ….
Compared with B, A …
Conclusion:
To sum up
In conclusion
It appears that…
The two charts clearly show…