雅思写作 – LINE GRAPH
WRITING TASK 1 (Test 2, Cambridge IELTS 7)
You should spend about 20 minutes on this task.
Write at least 150 words.
范文
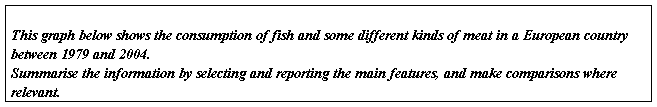
The graph illustrates changes in the amount of beef, lamb, chicken and fish consumed in a particular European country between 1979 and 2004.
In 1979, beef was by far the most popular of these foods, with about 225 grams consumed per person per week. Lamb and chicken were eaten in similar quantities (around 150 grams), while much less fish was consumed (just over 50 grams).
However, during this 25-year period the consumption of beef and lamb fell dramatically to approximately 100 grams and 55 grams respectively. The consumption of fish also declined, but much less significantly to just below 50 grams, so although it remained the least popular food, consumption levels were the most stable.
The consumption of chicken, on the other hand, showed an upward trend, overtaking that of lamb in 1980 and that of beef in 1989. By2004 it had soared to almost 250 grams per person per week.
Overall, the graph shows how the consumption of chicken increased dramatically while the popularity of these other foods decreased over the period.
(173 words)
WRITING TASK 1 (Test 4, Cambridge IELTS 8)

范文
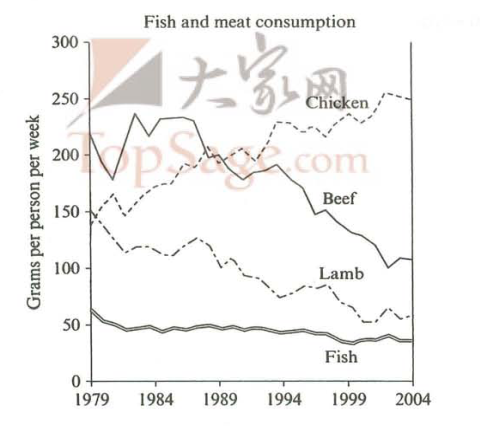
The graph illustrates the quantities of goods transported in the United Kingdom by four different modes of transport between the time period of 1974 and 2002. Over this span of 28 years, the quantities of goods transported by road, water and pipeline have all increased while the quantity transported by rail has remained almost constant at about 40 million tonnes.
The largest quantity of goods transported both in 1974 and 20## was by road (70 million tonnes and 98 million tonnes respectively) while the lowest both in 1974 and 20## was by pipeline (about 5 million tonnes and 22 million tonnes respectively). The amount of goods transported by water was constant from 1974 to 1978, where it showed an exponential growth, rising to almost 60 million tones after which it plateaued for about 20 years before starting to rise gradually again.
The amount of goods transported by rail is almost constant at 40 million tonnes in 1974 and 2002, with decreases in quantity in between the years. It is also interesting to note that almost all showed a decrease in 1994 in amount of goods transported except for the pipeline, which actually peaked in that year.
In conclusion the road remains the most popular method of transporting goods in the UK while water and pipelines are becoming increasingly used. In contrast, rail has not become more popular as a method of transport.
WRITING TASK 1 (Test 4, Cambridge IELTS 9)
范文
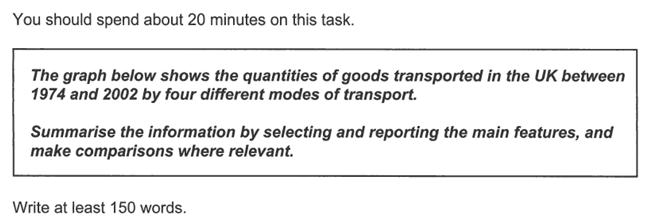
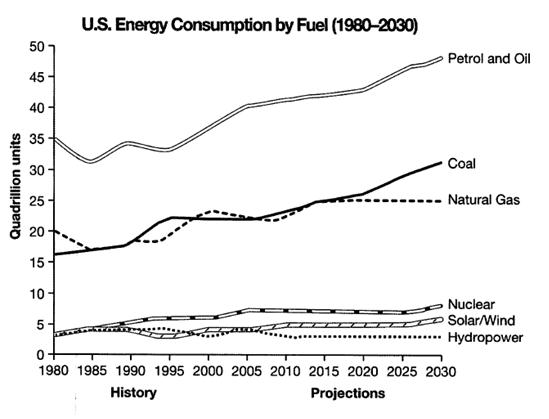
The graph shows energy consumption in the US from 1980 to 2012, and projected consumption to 2030.
Petrol and oil are the dominant fuel sources throughout this period, with 35 quadrillion (35q) units used in 1980, rising to 42q in 2012. Despite some initial fluctuation, from 1995 there was a steady increase. This is expected to continue, reaching 47q in 2030.
Consumption of energy derived from natural gas and coal is similar over the period. From 20q and 15q respectively in 1980, gas showed an initial fall and coal a gradual increase, with the two fuels equal between 1985 and 1990. Consumption has fluctuated since 1990 but both now provide 24q. Coal is predicted to increase steadily to 31q in 2030, whereas after 2014, gas will remain stable at 25q.
In 1980, energy from nuclear, hydro- and solar/wind power was equal at only 4q. Nuclear has risen by 3q, and solar/wind by 2. After slight increases, hydropower has fallen back to the 1980 figure. It is expected to maintain this level until 2030, while the others should rise slightly after 2025.
Overall, the US will continue to rely on fossil fuels, with sustainable and nuclear energy sources remaining relatively insignificant.
第二篇:雅思写作小作文图表范文
雅思写作小作文图表范文
很多同学在开始看到雅思考试的小作文的时候无从下手,因为在我们国家的教育中对这方面的训练较少。不过,小作文真心有用啊!不仅在雅思考试中,更是在出国后的论文里面。
今天给大家展示一篇图表范文,同学们雅思考试准备前简单熟悉一下。
You should spend about 20 minutes on this task.
The graph and table below give information about water use worldwide and water consumption in two different countries. Summarise the information by selecting and reporting the main features, and make comparisons where relevant. Write at least 150 words.
The graph shows how the amount of water used worldwide changed between 1900 and 2000.
Throughout the century, the largest quantity of water was used for agricultural Purposes, and this increased dramatically from about 500 km3 to around 3,000 km3 in the year 2000. Water used in the industrial and domestic sectors also increased, but consumption was minimal until mid-century. From 1950 onwards, industrial use grew steadily to just over 1,000 km3, while domestic use rose more slowly to only 300 km3, both far below the levels of consumption by agriculture.
The table illustrates the differences in agriculture consumption in some areas of the world by contrasting the amount of irrigated land in Brazil (26,500 km3) with that in the D.R.C. (100 km2). This means that a huge amount of water is used in agriculture in Brazil, and this is reflected in the figures for water consumption per person: 359 m3 compared with only 8 m3 in the Congo. With a population of 176 million, the figures for Brazil indicate how high agriculture water consumption can be in some countries.
这篇雅思作文范文近有180多词,但准确描述出两个图表中所表达的内容以及具体变化趋势,同学们可在雅思写作练习中参考。