Lab 5 Experiment of Absorption
I. Objectives
1. Understand the configuration of an absorption column
2. Determine the overall volumetric gas phase mass transfer coefficient , KYα
3. Understand the characteristics of single-film resistance.
II. Principles
In gas absorption process, a solute component is absorbed by contacting with a liquid phase, in which the component is soluble. In this experiment, water is used to remove ammonia from air. The absorption of NH3 in water is gas phase controlled. The gas phase coefficient approximately equals to the overall mass-transfer coefficient. Based on this, the overall volumetric mass-transfer coefficient can be evaluated.
When the mole fraction of solute in liquid is less than 10%, the equilibrium correlation obeys Henry’s law. The overall mass-transfer coefficient is
 (1.26)
where, h = height of packed section, m
KYα= overall volumetric gas phase mass transfer coefficient , kmol/m3﹒h
Y = mole ratio of solute to solvent in gas phase; Y1, inlet value; and Y2, outlet value
ΔYm = logarithm average driving force for gas phase
III. Apparatus
(1). Ammonia absorption apparatus and the process
Figure 1.7 presents a diagram of the gas absorption unit to be employed in this experiment. This unit consists of 3 rotameters, 4 manometers, 2 thermometers, 2 buffer tanks, an effluent gas analyzer and an absorption tower. An air-ammonia mixture is introduced to the bottom of the column and pure water is sprayed from the top of the column. The air flowing upward contacts with water stream flowing downwards, which absorbs ammonia.
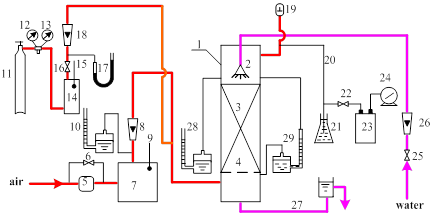
Fig. 1.7 Gas absorption apparatus
1—packed tower; 2—sprayer; 3—packed section; 4—grid; 5—air blower; 6—by-pass valve; 7—buffer tank;
8, 18, 26—rotameters; 9,15—thermometers; 10,17,28—manometer(open to atmosphere);11—ammonia cylinder;
12, 13—pressure gauge; 14—ammonia buffer tank; 16—ammonia control valve; 19—pressure regulating valve;
20—sampling pipe for effluent gas; 21—pressure accumulator; 22—stopcock; 23—absorption capsule;
24—wet-type gas flow meter; 25—water control valve; 27—drain pipe; 29—differential pressure meter
(2). Acetone absorption apparatus and the process
Figure 1.8 presents a diagram of the gas absorption unit to be employed in this experiment. This unit consists of 1 air compressor, 2 Raw material storage tank, 3 rotameters, 1 heater, 3 thermometers and an absorption tower. An air-acetone mixture is introduced to the bottom of the column and pure water is sprayed from the top of the column. The air flowing upward contacts with water stream flowing downwards, which absorbs acetone.
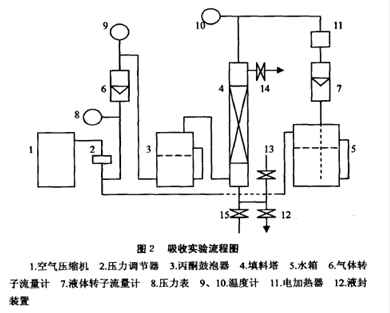
Fig. 1,8 Acetone absorption apparatus
1—air compressor; 2—pressure valuator; 3—acetone bubbler; 4—packed tower; 5—elevated tank;
6,7, 8—rotameters ; 9, 10—pressure gauge; 11—heater; 12,13, 14—thermometers; 15—by-pass valve;
16, 17, 18, 19—control valve
IV. Procedures
(1). Ammonia absorption
The columns must be wetted for at least 10 minutes in order to ensure complete wetting of the packing. The system must be allowed to operate for another 10 minutes to reach an equilibrium state. Record all temperatures, flow rates, difference pressures.
1. The effluent gas analyzer consists of an absorption capsule and a wet-type gas flow meter. Wash the absorption capsule with distilled water, drop 1 ml diluted sulfuric acid of a certain concentration with a suction pipette, and add distilled water to the tick mark. Joint the absorption capsule into the effluent gas analyzing pipeline after adding 1~2 drops of methyl red indicator.
2. Open the water valve. Set the water flow rate to a value about 50 L/h on the rotameter.
3. Turn on the Jaeger blower. Set the air flow rate to a value about 20 m3/h on the rotameter by regulating the by-pass valve.
4. Switch on the ammonia system under the supervising of the instructor. First, loose the spring of the reduction valve. Second, open the cut-off value. Third, regulate the reduction valve to the lower pressure of 0.05 to 0.08 MPa. Fourth, open the ammonia valve and set the ammonia flow rate to a value about 1 m3/h.
5. Allow the system operating for 10 minutes to reach a steady state.
6. Record all temperatures, difference pressures and flow rates.
7. Analyze the effluent concentration. First, record the initial value of the wet-type gas flow meter. Second, open the analyzing valve. Third, record the end value when reaching the end point.
8. Change either the gas flow rate or the liquid flow rate, and repeat the test.
9. Close the ammonia, air and water systems in order.
(2). Acetone absorption
1. Add acetone to the bubbler, and water is added to the elevated tank. The height of the container is controlled to about two-thirds by observing the glass tube level the gauge.
2. Check valves in front of the rotameters, and ensure they are in normal state; open the drain valve on the top of the packed tower, and close the pressure valuator 2.
3. Adjust the water flow to the predetermined value, and make the packed tower fully wetted. At the same time, open the water preheater, and adjust voltage to control the water temperature t1. Regulate the liquid level of the liquid seal to a stable value.
4. Switch on the air compressor according to the correct procedures, then control the pressure valuator and maintain 120 kPa; open the valve before the air rotameters, adjusting the flow to the predetermined value. Air is introduced into the acetone bubbler to obtain a mixed raw material via the vaporization of acetone, and the mixed gas is leaded in the absorption tower from its bottom. The gas flowing upward contacts with water stream flowing downwards, which absorbs acetone. Finally, the lean gas is discharged from the top of the tower export.
5. Allow the system operating for 10 minutes to reach a steady state, then record all temperatures, difference pressures and flow rates. The acetone concentration is analyzed by a gas chromatographic analysis (note that the exit gas is sampled at first, then the imported gas; the same sample is collected and analyzed for at least 3 times).
6. Maintain the water spray amount and change the air flow (the gas mixture concentration is still around 5%) to determine KYαon the basisn of the same procedures; or keep the air flow unchanged and change the water spray amount to determine KYα.
7. Close the acetone, air and water systems in order after the experiment is over.
V. Data records
(1) Records for ammonia absorption experiment
Type of packing: Height of packed section:
Column diameter: Packing size:
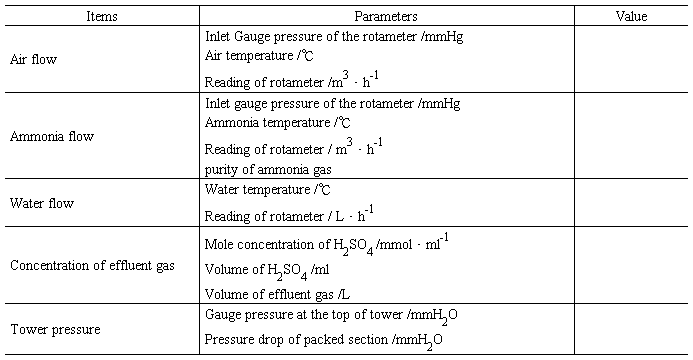
Table 1.5 Data records for ammonia absorption experiment
(2) Records for acetone absorption experiment
Type of packing: Height of packed section: m
Column diameter: m Packing size:
Air flow: m3·h-1 Water flow: m3·h-1
Room temperature: ℃ Atmospheric pressure: mmHg
Pressure of the pressure valuator: MPa
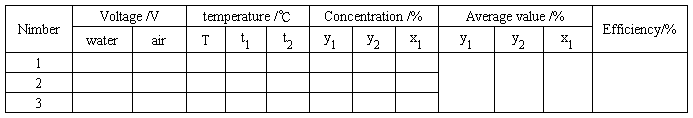
Table 1.6 Data records for acetone absorption experiment
VI. Data processing
(1) Data processing for ammonia absorption
1. Air flow
In order to obtain air flow rate, the volumetric flow rate under experimental conditions must be conversed to that under standard state ( 101.3kPa and 0℃):

where V0,V2 = air flow rates under standard state and experimental conditions respectively, m3/h
T = temperature of air, K; T0, under standard state, 273K; T1, under calibration state, 293K; T2,under experimental state
p= pressure of air, Pa; p0, under standard state, 101 330 Pa; p1, under calibration state, 101 330 Pa; p2, under experimental state
2. Ammonia flow rate
Ammonia flow rate can be calculated as follows:

where V = ammonia flow rate, m3/h;  , under standard state;
  , under experimental state
 =density, kg/m3;
  , density of air under standard state, 1.293 kg/m3;
  , density of ammonia under standard state, for ammonia purity of 98%
3. Molar mass velocity of air
Molar mass velocity of air is expressed as follows

where D = column diameter, m
G = molar mass velocity of air, kmol/m2.h
4. Mole ratio of ammonia to air in gas phase
The mole ratios of ammonia to air in gas phase are


where  =reading for wet-type gas flow meter, L
 = volume of sulfuric acid ,mL
 = mole concentration of sulfuric acid, mmol/mL
 = average local atmosphere, Pa
Y = mole ratio of ammonia to air in gas phase; Y1, at gas inlet; Y2, at gas outlet
5. Average forcing driver for gas phase
The average forcing driver for gas phase,  , is
, is

where  = mole ratio of ammonia to air for gas phase in equilibrium with X;
  , with X1;
  , with X2
X = mole ratio of ammonia to water for liquid phase; X1, at liquid outlet; X2, at liquid inlet
1)
The equilibrium value can be calculated as follows:


where E = Henry’s coefficient, Pa
p = operation pressure, Pa
m=phase equilibrium constant
Table 1 shows Henry’s coefficient varying with the temperature.
Table 1.7 Henry’s coefficients for ammonia-water

2) X1 and X2
For pure water, X2=0. X1 can be calcul
ated according to the overall material balance, i.e.,

where L = molar mass velocity of water, kmol/m2.h
6. Overall volumetric mass-transfer coefficient
The overall volumetric gas phase mass-transfer coefficient can be calculated as follows:

(2) Data processing for acetone absorption
1. Air flow
In order to obtain air flow rate, the volumetric flow rate under experimental conditions must be conversed to that under standard state ( 101.3kPa and 0℃):
where V0,V2 = air flow rates under standard state and experimental conditions respectively, m3/h
T = temperature of air, K; T0, under standard state, 273K; T1, under calibration state, 293K; T2,under experimental state
p= pressure of air, Pa; p0, under standard state, 101 330 Pa; p1, under calibration state, 101 330 Pa; p2, under experimental state
2. Molar mass velocity of air
Molar mass velocity of air is expressed as follows
where D = column diameter, m
G = molar mass velocity of air, kmol/m2.h
3. Average forcing driver for gas phase
T The average forcing driver for gas phase, , is
where = mole ratio of ammonia to air for gas phase in equilibrium with X; , with X1; , with X2
X = mole ratio of ammonia to water for liquid phase; X1, at liquid outlet; X2, at liquid inlet
1)
The phase equilibrium constant (m) of acetone in the air and the water can be calculated with the following empirical formula:

(10℃≤t≤50℃, 0.01≤x≤0.04)
Table 1.8 The phase equilibrium constant of acetone in the water solution

 ,
,
(2) Y, X
The gas concentation is calculated according to the following formula:


where  ,
,  — mole ratio of acetone to air for gas phase; Y1, at gas inlet; Y2, at gas outlet;
 ,
,  — mole fraction of acetone for gas phase; y1, at gas inlet; y2, at gas outlet;
L — molar velocity of water,kmol/(m2·h);
V、ρ — volume flow and density of water,m3/h、kg/m3;
M — molecular weight of water,kmol/kg;
D — tower diameter,m;
X1 — mole ratio of acetone to water at liquid outlet.
4. Overall volumetric mass-transfer coefficient
The overall volumetric gas phase mass-transfer coefficient can be calculated as follows:
VII. Report objectives
1. List the original data in table.
2. Calculate the overall volumetric mass-transfer coefficient,  .
.
3. Write calculation process.
VII. Questions
1. Why using the by-passing valve to adjust the gas flowrate of the Jaeger blower?
2. Based on the experimental data, gas absorption process is gas phase control or liquid phase control?
3. Why using a liquid seal at the bottom of the column? How the design the liquid seal?
4. When the inlet ammonia concentration is kept unchanged, how to increase the ammonia water concentration? Any problems will be result in?