篇一 :雅思小作文:饼图写法全解析

雅思小作文:饼图写法全解析

朗阁雅思考试研究中心

在雅思的学术类小作文中我们经常会遇到饼状图写作,不要看着一张一张的图,就退缩了,但是相对来说,这个题型还是比较容易写的一种图形,不过学生们也一定不要当做这是一件简单的事情,想要拿高分还是需要努力的,千万不能掉以轻心,否则不要就是因为这部分得分的不达标而影响到最后的综合得分。那么下面的文章中,朗阁雅思考试研究中心写作组的专家将要探讨的是饼图中静态数据和动态数据写法中的一些区别,并且将会从高分的角度来对各种写法作一汇总,希望对大家考试的准备有一定的帮助。

首先我们必须搞清楚什么是静态什么是动态数据的饼图:

雅思小作文饼图写法全解析

当我们在考试中看到这个图示上的数据都是固定的,没有发生任何变化的时候,那么就能够认定这属于静态数据,搞清楚之后我们就能够开始写作了。
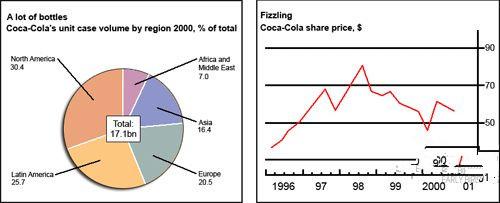
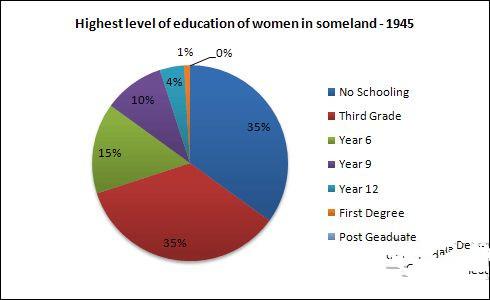
图二:

1

不要以为这里有很多的数据就属于动态的,其实这个图示还是表示是静态的,因为我们看到在途中的各项比重相对来说也是比较稳定的,因此这个饼图的数据也是属于静态的,那么究竟哪种数据属于动态的呢?
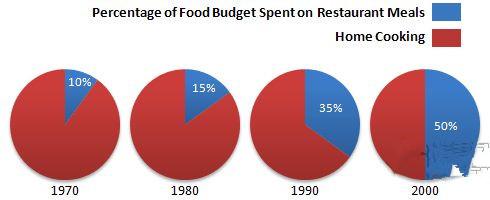
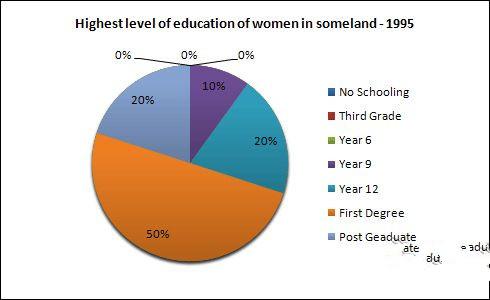
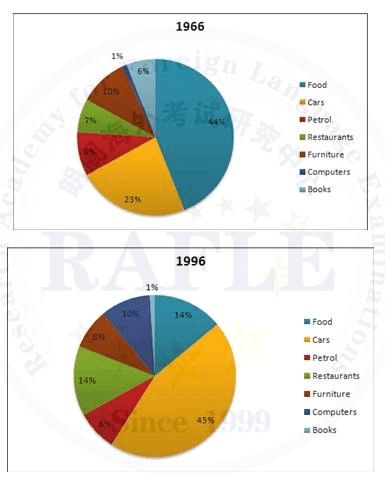
图三:

雅思小作文饼图写法全解析

2

这个就是动态的图示,为什么这么说呢,因为两张图种的占比数据上出现了很大的差异,这是两个年份的数据,但是各自的所占比重有所不同,所以是动态的数据。

由此,我们可以得出结论,如果我们看到的是一张饼图,而且描述的是一段时间之内比较稳定的数据,那么我们就能基本上断定那就是静态的数据,但是我们如果看到的时候两张饼图,在两个时间段时间的对比,数据出现了明显的变化,那么就能够基本上断定这张图表示的就是动态的题型。

雅思小作文饼图写法全解析

3

一、静态数据饼图的主体段写作理论

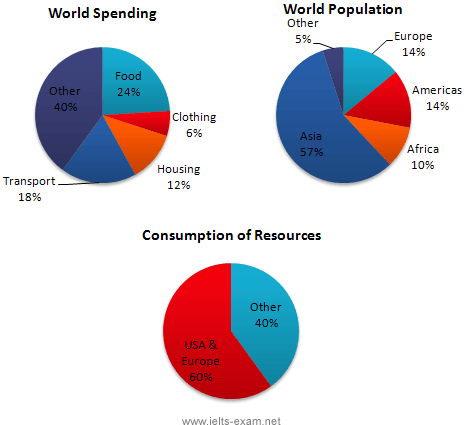
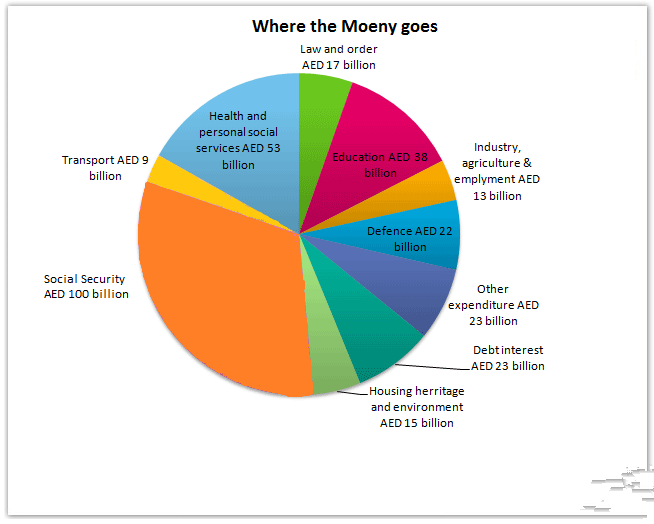
朗阁雅思考试研究中心建议考生可先按照扇形面积大小从大到小排列数据,若遇到饼图中有总数的描述,宜在开头先写。主体段在描写各个扇形数据的时候,要注意详略,即最大和第二大的扇形要重点描述。下面我们先以图一作为例子来详细解读这种写作套路:

…… …… 余下全文

篇二 :雅思饼状图范文

饼状图范文:

This is a pie chart that shows the proportion of the meal sold in a supermarket. The total meat sold in the supermarket is classified into six types as follows: chicken, pork, beef, lamb, fish and others.Overall, chicken has the largest proportion, which accounts for 40%; while others has the smallest percentage, at 2%.

As can be seen in the pie chart, chicken, which makes up 40%, is the most popular among the total meat sold, then next is pork with 20%, followed by beef, constituting 18%; and finally come lamb, fish and others at 15%, 5% and 2% respectively, It should be noted that the sale of pork is half as much as that of chicken. And it is also interesting to note that the sale of chicken is 20 times as much as that of others.

It can be concluded from the pie chart that chicken is most commonly bought meat while others is the least commonly bought meat.

…… …… 余下全文

篇三 :雅思小作文饼状图

You should spend about 20 minutes on this task. Write a report for a university

雅思小作文饼状图

lecturer describing the information shown below. You should write at least 150 words.

In this analysis we will examine three pie charts. The first one is headed ‘World Spending.’ The second is ‘World Population’ and the third is ‘Consumption of Resources.’

In the first chart we can see that people spend most of their income (24%) on food. In some countries this percentage would obviously be much higher. Transport and then housing are the next major expenses at 18% and 12% respectively. Only 6% of income is spent on clothing.

In the second chart entitled ‘World Population’, it is not surprising to find that 57% of people live in Asia. In fact China and India are two of the most populated countries in the world and they are both situated on this continent. Europe and the Americans account for nearly 30% of the total, whilst 10% of people live in Africa.

…… …… 余下全文

篇四 :雅思写作Task1饼状图考官范文(1)


雅思写作Task1饼状图考官范文(1)

  这是一篇雅思写作Task1饼状图考官范文。认真研读一定的雅思范文及作文模板可以帮助我们检验自己的写作水平,并能很好地吸收和应用优秀范文里的优秀内容。

  The chart and graph below give information about sales and share prices for Coca-Cola.

  Write a report for a university lecturer describing the information shown below.


  Sample Answer:

  The given pie chart and line graphs show the data on sales volume and share price of Coca-Cola. As is given in the illustration, in the year 2000, Coca-Cola was sold most in America where it had more than 55% sales volume. The share price of Coca-Cola was highest in 1998 and reached to around 55 in 20## with some fluctuation.

  As is presented in the pie chart, in 2000, Coca-Cola had more than 55% sales in Latin and North America. In Europe it had more than 20% sales volume, in Asia 16.45% and in Africa it had 7% sales volume. This indicates that American continent has the largest market for Coca-Cola while this market is least in African Continent.

…… …… 余下全文

篇五 :雅思写作Task1饼状图考官范文(3)


雅思写作Task1饼状图考官范文(3)

  本文为大家收集整理了雅思写作Task1饼状图考官范文(3)。认真研读一定的雅思范文及作文模板可以帮助我们检验自己的写作水平,并能很好地吸收和应用优秀范文里的优秀内容。

  The charts below show the percentage of food budget the average family spent on restaurant meals in different years. The graph shows the number of meals eaten in fast food restaurants and sit-down restaurants.

  Write a report for a university lecturer describing the information in the graph below.


  Sample Answer:

  The given illustration compares the amounts spent on restaurant foods and on home cooking foods in four different years and gives data on the number of meals eaten in two different restaurant types.

  As is presented in the pie chart, initially in 1970, 90% of total food budget was spent on home-made foods while only 10% was spent on restaurant foods. The amount spent on restaurant meals increased to 15% in 1980 while it reached to 35% in 1990. Finally in 200 average family spent half of the total budget in restaurant meals and that shows a rapid increase on the people’s habit of having meals in restaurants.

…… …… 余下全文

篇六 :雅思写作Task1饼状图考官范文(5)


雅思写作Task1饼状图考官范文(5)

  本文为大家收集整理了雅思写作Task1饼状图考官范文(5)。认真研读一定的雅思范文及作文模板可以帮助我们检验自己的写作水平,并能很好地吸收和应用优秀范文里的优秀内容。

  The pie chart gives information on UAE government spending in 2000. The total budget was AED 315 billion.

  Summarize the information by selecting and reporting the main features, and make comparisons where relevant.


  Model Answer:

  The given pie chart shows the UAE government’s spending in different sectors for the year 2000. As is given in the presentation, the UAE government had AED 135 billion budget for the year 20## and they spent the highest amount in Social Security.

  According to the pie chart, the UAE government spent AED 100 billion in social security among their total budget of AED 315. This single sector cost the UAE government almost one third of the total budget. This year the government spent 53 million on health and personal social services which was the second largest sector in terms of expenditure made by the UAE government in this year. 38 million AED was spent on education while 23 billion was spent both in debt and other expenditures. The government spent 22 billion in Defence sector while 13 billion was spent for the industry, employment and agriculture sectors. The lowest money spent was in transport sector which was only 9 billion. Finally 15 billion of the budget was spent on housing and environment.

…… …… 余下全文

篇七 :1.雅思饼图写作范文一

饼图写作范文一

The pie chart indicates how the U.S. budget is spent in six aspects including human resources, general government, physical resources, current and past military and Iraq & Afghan wars in 2004.

Money spent in human resources accounts for 32 percent of the total, occupying the largest share in the whole budget. The second largest one is given to current military with 27 percent of the budget. Past military receives money ten percent less than current military, followed by general government which constitutes 13 percent. The two aspects offered the least money in the budget are physical resources and Iraq & Afghan wars, making up 8 and 3 percent respectively.

Current military, past military and Iraq & Afghan wars, if considered separately, are not the largest money receiver in the budget. The three aspects in total, however, account for 49 percent of the budget, much higher than human resources, let alone general government and physical resources.

…… …… 余下全文

篇八 :雅思写作Task1饼状图考官范文(2)


雅思写作Task1饼状图考官范文(2)

  本文为大家收集整理了雅思写作Task1饼状图考官范文(2)。认真研读一定的雅思范文及作文模板可以帮助我们检验自己的写作水平,并能很好地吸收和应用优秀范文里的优秀内容。

  The pie chart below shows information on the highest level of education of women in someland in 1945 and 1995.

  Write a report for a university lecturer describing the information in the two graphs below.


  Sample Answer:

  The given pie charts compare the highest education level among women of someland in 50 years duration. As is observed from the given data, the women made remarkable progress in education over the 50 year’s period in someland.

  Initially in 1945, more than one third women in someland did not have any schooling experience while another one third could manage education till third grade only. Less than 1% women in this year managed to get their graduation or post-graduation degree. This reflects the poor education level among the female of someland in 1945.

…… …… 余下全文