篇一 :雅思小作文技巧及范文

                     雅思小作文写作技巧及范文

一.图表类型

饼状图,直方图或柱形图 趋势曲线图  表格图   流程图或过程图  程序图

二.解题技巧

A. 表格图

1横向比较: 介绍横向各个数据的区别,变化和趋势 2纵向比较:介绍横向各个数据的区别,变化和趋势  3无需将每一个数据分别说明,突出强调数据最大值和最小值,对比时要总结出数据对比最悬殊的和最小的

说明:考察例举数字的能力和方法。注意怎样通过举一些有代表性的数据来有效地说明问题。

B. 曲线图

 1极点说明: 对图表当中最高的,最低的点要单独进行说明

 2趋势说明: 对图表当中曲线的连续变化进行说明,如上升,下降,波动,持平

 3交点说明: 对图表当中多根曲线的交点进行对比说明

说明:关键是把握好曲线的走向和趋势,学会general classification,即在第二段的开头部分对整个曲线进行一个阶段式的总分类,使写作层次清晰。接下来在分类描述每个阶段的specific trend,同时导入数据作为你分类的依据。注意不要不做任何说明就机械性的导入数据!可以使用一些比较native的单词和短语来描述trend。
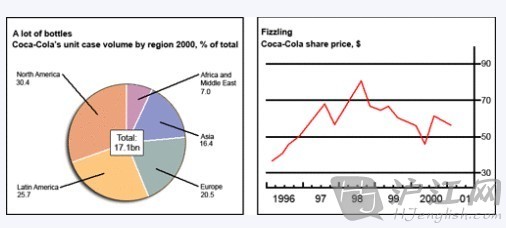
C. 饼状图

  1介绍各扇面及总体的关系  2各个扇面之间的比较,同类扇面在不同时间,不同地点的比较 3重点突出特点最明显的扇面:最大的,最小的,互相成倍的
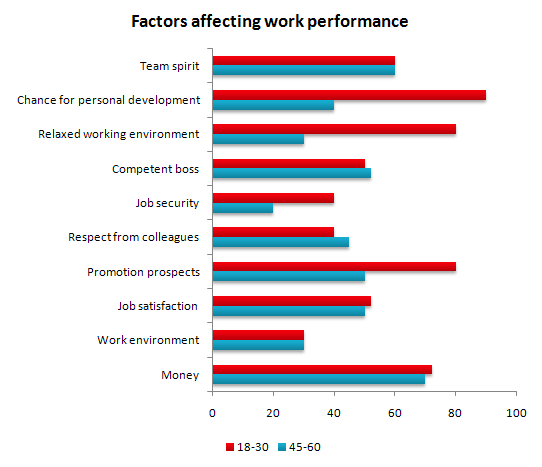
D. 柱状图

1.比较: similarity  2.对比: difference)

…… …… 余下全文

篇二 :雅思小作文范文

IELTS套句式写作大全

第一部分:TASK1图表写作套句精选

1.the table shows the changes in the number of...over the period from...to...

该表格描述了在...年之...年间...数量的变化。

2.the bar chart illustrates that...

该柱状图展示了...

3.the graph provides some interesting data regarding...

该图为我们提供了有关...有趣数据。

4.the diagram shows (that)...

该图向我们展示了...

5.the pie graph depicts (that)....

该圆形图揭示了...

6.this is a cure graph which describes the trend of...

这个曲线图描述了...的趋势。

7.the figures/statistics show (that)...

数据(字)表明...

8.the tree diagram reveals how...

该树型图向我们揭示了如何...

9.the data/statistics show (that)...

该数据(字)可以这样理解...

10.the data/statistics/figures lead us to the conclusion that...

这些数据资料令我们得出结论...

11.as is shown/demonstrated/exhibited in the diagram/graph/chart/table...

如图所示...

12.according to the chart/figures...

根据这些表(数字)...

…… …… 余下全文

篇三 :老外的标准雅思小作文范文(分享)

第三节  观点之间的连贯

Firstly/ primarily/ initially/

其他参考:

v      The first and most important thing is (concerned with)

v      The first important factor being taken into account is that

v      … should be put in the first place

v      A crucial element has to be considered with regards to teaching quality.

v      We may mention/ point out the indisputable/ undeniable fact that

Secondly/ additionally/in addition/ also/ admittedly/ furthermore/ moreover/ besides/

v      Besides, we should not neglect that

v      Apart from this (in addition to this), another aspect/ factor is concerned with

v      Another special consideration in this case is that

…… …… 余下全文

篇四 :【雅思小作文】组合图(曲线图+饼图)写作范例

组合图是雅思小作文里常考的题型之一,其写作非常值得我们深入研究。现专供一组合图(组合图+饼图或pie chart + line chart)写作范例和各位“雅友”一起分享,期望对大家的组合图写作带去一些启发和帮助。

不过,在鉴赏前还是请各位先看图表,并思考以下问题:

* 饼图和曲线图各自展示了什么数据在哪个时间点或段的变化特征?

* 在饼图中,数据总值为多少?它由几部分组成?每一部分各代表什么?各自所占百分比又是多少?百分比从大到小如何排列的?谁最大?谁最小?

* 曲线图有何特征?根据特征,曲线可以分成几段来描述?起点值、终点值、峰值、谷值多少?各自对应的时间点又是什么?

WRITING TASK 1:

雅思口语考试最新评分标准

雅思考试小作文—图表作文逻辑分析

雅思流程图作文—你不知道的秘密

雅思写作流程图的注意事项

如何在20分钟内写出不低于6分的雅思小作文

雅思流程图作文的注意事项

雅思零基础三个月创6分奇迹

You should spend about 20 minutes on this task.

* The chart and graph below give information about sales and share prices for Coca-Cola.

* Summarise the information by selecting and reporting the main features, and make comparisons where relevant.

You should write at least 150 words.

写作范文:

The pie chart shows the worldwide distribution of sales of Coca-Cola in the year 20## and the graph shows the change in share prices between 1996 and 2001.

…… …… 余下全文

篇五 :雅思小作文模版

开头1This graph/pie chart/table/bar chart reflects the (rate/percentage/proportion/number …) of (对

象)in(place/country)from …to…

2According to the figure , it is not spurring findings that there was/were 总体趋势的描述(the overall trend tended to indicate…/the general trend is…/其他)

结尾1In conclude , the overall trend tended to illustrate ……during this **-year period

2the data/statistics/figures lead us to the conclusion that……这些数据资料令我们得出结论……

线状图1.先(上升/下降)后(下降/上升),之后便平稳

(1)According to the data , the years from …to…saw/winess a rise/climb/drop in the number/rate/percentage/proportion of 对象 from数据to数据,which was followed by a rapid decrease/reduce/increase over the ** years.

(2)The number/rate…droped/went up again from…in ** year to…in ** year and then went up/clined gradually until ** year ,when there was a leveling off/leveling out at 数据 for 一段时间。

…… …… 余下全文

篇六 :雅思小作文8分范文

Sample Answer 1:

The given graph presents information on a variety of reasons that tend to impact job performance and it is divided by differentiating between two age categories of 18-30 years and 45-60 years. The data sample(=results of survey) is collected from a personnel department at a big company.

As is presented as a result of a survey in the given bar chart, for the both age group of 18-30 and 45-60, team spirit affects work performance equivalently and that is little over 60%. The reason ' chance for personal development' works for the younger age group about 90% which is more than twice than the older age group.(younger,older用比较级来说两个组,age不漏) The similar scenario is true for the relaxing environment too and this reason affects more than 80% to the 18-30 age group workers and about only 30% to the 45-60 years workers. About 45% younger workers' work performance is affected by the job security compared to little over 20% older workers. The only case where 45-60 years workers are influenced more than (被动的使用)their younger counterpart is 'respect from colleagues' which is about 50% for this age group workers in contrast to 40% (approximately ) for the 15-30 years age group. Promotional prospects is a reason that drive younger employees to work better and this reason affects 80% younger workers compared to almost 45% aged job holders.  For the lower age group job satisfaction, work environment & money affects their job performance about 50%, 30% & about 75% consecutively compared to about 45%, 30% and 70% of 45-60 years job holders.

…… …… 余下全文

篇七 :雅思小作文模板汇总

雅思小作文模板汇总

1 according to the chart```

2 the date lead us to the conclusion that```

3 the date show```

4 the tree diagram reveals how```

5 the figures show```

6 this is a cure graph which describes the trend of``` 7 the pie graph depicts```

8 the graph provides some interesting date regrarding```

9 the table shows the changes in the number of ``` over the period from ```to ```

10 as is shown in the table ```

11 from the table ,we can clearly see that ```

12 this table shows the changing proportion of X and Y from ``` to ```` 13 the graph,presented in a pie chart, shows the general trend in``` 14 as can be seen from the grape ,the two curves show the flutuation of ```

15 over the period from ```to ```the```remained level. 16 in the year between ```and ```.

…… …… 余下全文

篇八 :雅思小作文模板

 1、According to the first graph, it can be seen that ______________, it can also be concluded from it that ______________.

  通过第一个曲线图,我们可以知道____,也说明了结果是___

  2、There is an interesting and instructive picture which goes like this: __________.

  一张有趣、有教育意义的、(内容)的图片(这句模板在雅思小作文中的应用非常的广泛。)

  3、Nowadays there is a growing concern over ______________. Many people like ______________, while others are inclined to ______________.

  当前有一张涉及______的增长曲线图,许多人______,然而其他人倾向于___

  4、Nowadays, it is common to ______________. Many people like______________ because ______________. Besides, ______________.

  目前,共同之处是_________,许多人喜欢______因为_______除此之外还由于_____

  5、Just like many other things, are preferred by ____________. While being attacked by the idea that ______________, some people consider ______________. They point that ______________.

…… …… 余下全文