篇一 :雅思写作Task1流程图考官范文(7)


雅思写作Task1流程图考官范文(7)

  本文为大家收集整理了雅思写作Task1流程图考官范文。认真研读一定的雅思范文及作文模板可以帮助我们检验自己的写作水平,并能很好地吸收和应用优秀范文里的优秀内容。

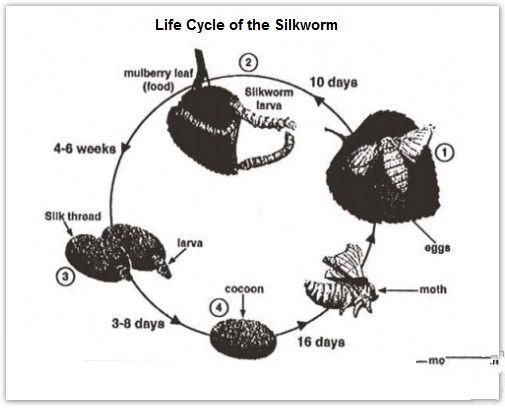
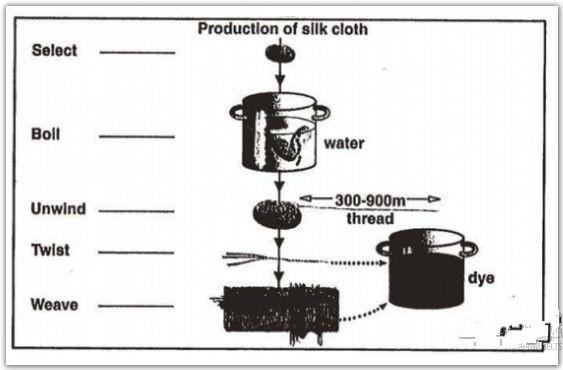
  The diagrams below show the life cycle of the silkworm and the stages in the production of silk cloth.

  Summarise the information by selecting and reporting the main features, and make comparisons where relevant.


  Sample Answer:

  The given pictorials show the life cycle of the silkworm and also shows the processes of silk cloth productions.

  The life cycle of a silkworm begins from the eggs laid by the mother worm and from these eggs the silkworm larva are generated after 10 days. The silkworm larva usually eats leaf like mulberry leaf and completes the second stage of the life cycle in 4-6 weeks. In their third stage, they create silk thread shells and remain there for another 3 to 8 days and then create an oval cocoons. The cocoon-stage lasts for around 16 days and they become moth in the final stage. With time the moths become grown-up and recycle the processes again.

…… …… 余下全文

篇二 :雅思写作 task1 高分写作技巧

雅思写作 task 1 写作总概 Corrine

雅思写作 Task 1图表小作文

第一节 简 介

一. 图表简介:

雅思写作task1高分写作技巧

图表通常分为两大类。一类是数据图,包括曲线图(graph/ line chart),柱状图(bar chart/ column chart),饼状图(pie chart)和表格(table)。

另一类是示意图/流程图(diagram/flow chart)。目前在雅思考试中主要出现的是数据图。

雅思写作task1高分写作技巧

最多柱状图,其次曲线图,再者饼状图,表格。

雅思写作task1高分写作技巧

雅思写作task1高分写作技巧

词汇语法:词汇准确多样,不能重复 those who work in = people working in = the employee in 句子:结构不能太简单,一句话要同时写两个对象的特征。

逻辑:句子里,句子与句子之间,段与段之间都要使用表示对比,转折,相似的连词或副词。

时态:第一句使用一般现在时,主体部分大多用一般过去式。

二. 图表作文审题

审题包括审读题目要求或说明以及查看图表及其注解。题目的文字部分一般提供了有关这个图表的最基本信息,如所涉及的背景、研究的对象、时间和地点。对于图表部分,我们需要仔细考察,查看纵横轴等,找出值得描述的主要规律和特征、关键点( 最高,最低值,中间值、相似类的)、总体趋势(overall trends)和不规则变化(irregularities 上升,下降,持平的)。

1

雅思写作 task 1 写作总概 Corrine

第二节 常 用 基 本 句 式

开头段

雅思写作task1高分写作技巧

主体段

一. 描述信息出处

雅思写作task1高分写作技巧

2

雅思写作 task 1 写作总概 Corrine

二.动态变化描写

1)上升/ 下降 (用变化动词)

雅思写作task1高分写作技巧

3

雅思写作 task 1 写作总概 Corrine

2)上升/ 下降 (用变化名词)

…… …… 余下全文

篇三 :雅思写作Task1表格图考官范文(1)


雅思写作Task1表格图考官范文(1)

  这是一篇雅思写作Task1表格图考官范文,供大家参考。认真研读一定的雅思范文及作文模板可以帮助我们检验自己的写作水平,并能很好地吸收和应用优秀范文里的优秀内容。

  The first chart below shows the results of a survey which sampled a cross-section of 100,000 people asking if they traveled abroad and why they traveled for the period 1994-98. The second chart shows their destinations over the same period.

  Write a report for a university lecturer describing the information shown below.


  Sample Answer:

  The provided charts shows the data of a survey conducted on 100,000 people and the statistics shows the number of UK citizen travelled abroad during 1994 to 1998 for different purposes and their destinations. As is observed from the given graphs, most of the UK residents travelled on their holidays and Western Europe was their most favourite destination.

…… …… 余下全文

篇四 :雅思写作Task1书信考官范文(1)


雅思写作Task1书信考官范文(1)

  这是一篇雅思写作Task1书信考官范文,供大家参考。认真研读一定的雅思范文及作文模板可以帮助我们检验自己的写作水平,并能很好地吸收和应用优秀范文里的优秀内容。

  You recently took a part-time job working for a local company. After a few weeks you realised there were some problems with the job.

  Write a letter to the manager of the company. In your letter

  -- explain why you took the job

  -- describe the problems that you experienced

  -- suggest what could be done about them.

  Model Answer:

  Dear Mr. Adison,

  I am a part-time call-centre operator at your company, started working about 4 weeks ago. I am writing to indicate the problem I encountered during my work.

  Actually, I decided to took the position of a telesales specialist because consider myself able to develop a career in sales due to my skill of establishing good contact with people and make them trust me. However, I realised there are some obstacles on a way to success.

…… …… 余下全文

篇五 :雅思写作Task1图表作文写作方法

雅思写作Task1图表作文写作方法
寫作測驗第一部份:描述圖表資訊

第一部份寫作測驗的目的是要評量考生是不是有描述圖表、圖形或表格等不同資料形式的能力。在英國,大部分大學以上的學生必須寫這樣的文章,所以對一個將到英國唸書的學生來說,是一個必備的能力。

第一 : 瞭解圖形資訊
下筆之前,第一要瞭解圖表中的資料,第二要構思怎麼回答問題和如何分段組織。

第二 : 瞭解圖表中的資料
第一要找圖表或表格旁的標題或主題, 如此可以大概了解圖形的內容。第二要找出圖形中各項資料的關係,大部分的數據資料會用來顯示兩組或更多組資料之間的關係。通常,這些資訊會寫在標題欄和標題列上。第三找出資料的特徵和趨勢,例如 20##年到20##年,越來越少小孩被生出來之類的資訊走向。

第三 : 組織和構思文章
寫文章時一定要根據自己的想法組織仔細分段,而第一段通常是引言,可以描述一下圖表的基本資訊,說明將要描述的資料, 然後做評論。本文的部分,要分幾段來描述圖表上的資訊。最後一部分是結論,要將所描述的資料做總結並且解釋發現到的趨勢。有時候,題目會要求對形成趨勢的原因或理由作評論,而不錯的結論可能會有加分效果。

数据图表:a data graph图表, 曲线图/chart/diagram图解, 简图, 图表,示意图/illustration说明, 图解, 图示/table      
饼图:pie chart  
表格图:table
直方图或柱形图:bar chart / histogram柱状图             
趋势曲线图:line chart / curve diagram 曲线统计图
流程图或过程图:flow chart / sequence diagram      
程序图:processing/procedures diagram
圆柱图:column chart 

…… …… 余下全文

篇六 :雅思写作Task1流程图考官范文(1)


雅思写作Task1流程图考官范文(1)

  这是一篇雅思写作Task1流程图考官范文,供大家参考。认真研读一定的雅思范文及作文模板可以帮助我们检验自己的写作水平,并能很好地吸收和应用优秀范文里的优秀内容。

  The diagram below shows the typical stages of consumer goods manufacturing, including the process by which information is fed back to earlier stages to enable adjustment.

  Write a report for a university lecturer describing the process shown.

  Sample Answer 1:

  The given diagram shows the stages of manufacturing and process adjustment of the consumer goods. As is observed from the flow chart, the goods manufacturing is a complex process which is done in several stages and information is sometimes fed back to earlier stages to make some adjustments.

  Firstly, raw materials and other components are stored together and production planning is done. There are two major process involves in the overall manufacturing process: one is manufacturing process itself and another one is the information feedback process with which the adjustment of the manufacturing is done. After the product research, the design part is done and this input is used in product planning stage. After the production planning is complete the assembly, inspection, testing and packaging stages are done sequentially. Feedback from testing phase is used in design stage and which led back to product planning stage. Again, the market research affects the design and advertising stages and inputs from the market research stage is used in packaging stage. The final two stages are dispatch and sales. The information flow stages gives feedback to other stages to refine and adjust the process.

…… …… 余下全文

篇七 :雅思写作Task1曲线图考官范文(1)


雅思写作Task1曲线图考官范文(1)

  这是一篇雅思写作Task1曲线图考官范文。认真研读一定的雅思范文及作文模板可以帮助我们检验自己的写作水平,并能很好地吸收和应用优秀范文里的优秀内容。

  The graphs below show the numbers of male and female workers in 1975 and 1995 in several employment sectors of the republic of Freedonia.

  Write a report for a university teacher describing the information shown.


        Sample Answer:

  The provided line graphs compare the employment history of men and women in 1975 and 1995 dividing in six major sectors namely: manufacturing, communications, finance/ banking, wholesale & retail trade, non-defence public sectors and defence public sectors. As is observed from the given illustration, significant changes have been made in women's employment and women appear to have made remarkable improvements in almost the entire job sectors in Freedonia and in some sectors women went well ahead of men.

…… …… 余下全文

篇八 :雅思写作Task1饼状图考官范文(1)


雅思写作Task1饼状图考官范文(1)

  这是一篇雅思写作Task1饼状图考官范文。认真研读一定的雅思范文及作文模板可以帮助我们检验自己的写作水平,并能很好地吸收和应用优秀范文里的优秀内容。

  The chart and graph below give information about sales and share prices for Coca-Cola.

  Write a report for a university lecturer describing the information shown below.


  Sample Answer:

  The given pie chart and line graphs show the data on sales volume and share price of Coca-Cola. As is given in the illustration, in the year 2000, Coca-Cola was sold most in America where it had more than 55% sales volume. The share price of Coca-Cola was highest in 1998 and reached to around 55 in 20## with some fluctuation.

  As is presented in the pie chart, in 2000, Coca-Cola had more than 55% sales in Latin and North America. In Europe it had more than 20% sales volume, in Asia 16.45% and in Africa it had 7% sales volume. This indicates that American continent has the largest market for Coca-Cola while this market is least in African Continent.

…… …… 余下全文