篇一 :英语图表作文

简介

图表作文是考研英语写作中较为常见的题型之一,也是难度较大的一种写作题型。这类作文可综合提供题目、数据、图像、提纲,形式多样,但实际上只涉及5个方面:描述图表、指明寓意、分析原因、联系实际、给出建议,而每次考试只是从这5个方面的内容中选出3个结合在一起。从写作类型来看,基本上属于说明文。要求考生围绕题目将有关信息转化为文字形式,考生应该具有一定数据分析和材料归纳的能力,同时会运用一定的写作方法。考研试题一般以三段式写作方法来组织文章,第一段总结归纳信息反映的整体情况,点出主题思想,第二段回答第一段所得出的问题,对数字、数据等做出有条理的分析比较,第三段做出总结或给以简单的评论。

特殊点

图表类写作题一向是中考书面表达中的难点。它不象看图叙事和提示作文那样直观明了,文体多以说明文和议论文为主。考查时要求同学们根据所给的图表、数据等进行分析、研究,阅读其中的文字和说明,弄清各种信息之间的关系,提炼要点,然后组织语言进行写作,必要时还要加入作者自己的观点。

和看图叙事不同的是,写图表作文时对图表和数据内容不必全部描述,只需重点引用能支持观点的一些数据。分析图表时切不可凭空想象,要善于抓住总的规律和趋势。时态方面除特定的时间用过去时外,常用一般现在时。

结构

图表作文的结构通常是三段式:

第一段分析图表中的数据变化反映出的问题或趋势,简要概述图表所揭示的信息;

第二段分析原因;

第三段提出解决问题的办法或建议。

三种形式

3种形式

1.调查图

如20xx年河南试验区中考卷关于"学生吸烟情况"的调查图,

20xx年包头市关于学生视力下降原因的调查;

2. 表格

如20xx年盐城中考卷根据表格设计宣传单饼提出给驾驶员和行人的2条建议;

20xx年大连中考卷关于班级去年今年情况对比的表格等;

20xx年哈尔滨中考关于压岁钱的使用情况表。

…… …… 余下全文

篇二 :高考英语图表作文模板[1]

英语图表作文模板推荐

The chart gives us an overall picture of the ____________(图表主题)。The first thing we notice is that_______________(图表最大特点)。This means that as __________, _________________(进一步说明)。

We can see from the statistics given that _______________(图表细节一)。After ving_________(细节一中的第一个变化), the _____Ved+幅度+时间(紧跟着的变化)。The figures also tells us that_________________________(图表细节二)。(数据位置,如In the second column), we can see that ____________accounts for _______(进一步描述)。

Judging from these figures, we can draw the conclusion that___________(结论)。The reason for this, as far as I am concerned is that_____________(给出原因)。/It is high time that we Ved(发出倡议)

英语四六级作文模板大全(二) 图表式作文模板
It is obvious in the graphic/table that the rate/number/amount of Y has undergone dramatic changes. It has gone up/grown/fallen/dropped considerably in recent years (as X varies). At the point of X1, Y reaches its peak value of …(多少). What is the reason for this change? Mainly there are … (多少)reasons behind the situation reflected in the graphic/table. First of all, …(第一个原因). More importantly, …(第二个原因). Most important of all, …(第三个原因). From the above discussions, we have enough reason to predict what will happen in the near future. The trend described in the graphic/table will continue for quite a long time (if necessary measures are not taken括号里的使用于那些不太好的变化趋势).

…… …… 余下全文

篇三 :英语图表作文范文

英语图表作文范文 

 日用花销统计

  Statistics in People's Daily Expenses in Xi'an

  YearItem 1995 1996 1997 1998 1999

  Food 66% 61% 48% 41% 36%

  Clothing 9% 10% 12% 15% 18%

  Recreation 4% 5% 8% 9% 11%

  [2.图画/图表描述段]What is shown in the table above indicates that dramatic changes have taken place in the daily expenses in Xi' an from 1995 to 1999. The expenses on food have declined by 30% while those on clothing and recreation have increased respectively by 9% and 7%. The statistics of rise and fall seem to exist in isolation but closely related to one another.

  [6.原因列军段]There are two factors accounting for these changes. Development in economy is an essential one in the five years. The increased income resulting from economic growth plays an important part in the less expense on food. Hence, a small percentage of total income is enough to cover food expense. Another one is the changes in life style. When food presents no worry to the average, people begin to focus more of interest on handsome appearance and happy leisure time. As a result of such a shift, spending on clothing and recreation increased year after year.

…… …… 余下全文

篇四 :高考英语写作之图表作文(格式与范例)

图表类作文模板句型

As can be seen from/in the chart/diagram/table/graph...  从表格/图形中我们可以看到…… 

According to /As is shown in the Table /Figure/Chart...如表格/图表中显示…… It can be seen from the chart/diagram/table/graph/figures/statistics that...  从表格/图表/数据中我们可以看到…… 

From the table/figures/data/results/information above, it can/may be seen/concluded/shown/estimated/calculated/inferred that...  从以上的表格/图表/数据/结果/信息中,我们可以看到/总结/预测/计算/得出…… 

The table shows the changes in the number of...over the period from...to...  该表格描述了在……年之……年间……数量的变化。 

As can be seen from the graph, the two curves show the fluctuation of...如图所示,两条曲线描述了……的波动情况。 

…… …… 余下全文

篇五 :高考英语图表作文模板

英语图表作文模板推荐

The chart gives us an overall picture of the ____________(图表主题)。The first thing we notice is that_______________(图表最大特点)。This means that as __________, _________________(进一步说明)。

We can see from the statistics given that _______________(图表细节一)。After ving_________(细节一中的第一个变化), the _____Ved+幅度+时间(紧跟着的变化)。The figures also tells us that_________________________(图表细节二)。(数据位置,如In the second column), we can see that ____________accounts for _______(进一步描述)。

Judging from these figures, we can draw the conclusion that___________(结论)。The reason for this, as far as I am concerned is that_____________(给出原因)。/It is high time that we Ved(发出倡议)

英语四六级作文模板大全(二) 图表式作文模板
It is obvious in the graphic/table that the rate/number/amount of Y has undergone dramatic changes. It has gone up/grown/fallen/dropped considerably in recent years (as X varies). At the point of X1, Y reaches its peak value of …(多少). What is the reason for this change? Mainly there are … (多少)reasons behind the situation reflected in the graphic/table. First of all, …(第一个原因). More importantly, …(第二个原因). Most important of all, …(第三个原因). From the above discussions, we have enough reason to predict what will happen in the near future. The trend described in the graphic/table will continue for quite a long time (if necessary measures are not taken括号里的使用于那些不太好的变化趋势).

…… …… 余下全文

篇六 :英语四级图表+图画作文讲解及参考范文

英语四级图表和图画作文讲解及参考范文

一、图表作文

图表作文也是四(六)级考试中常见,而且被认为是一种较难的作文形式。图表作文就是把非文字信息(通常为各种图表表示的数字信息等)转换成文字信息的一种作文。它要求我们用文字来描述非文字性的图表或对图表显示的关系作解释说明。

第一节 图表作文的出题形式和写作要领

一、图表作文常见出题形式

图表作文一般在题目中给出作文的标题和一个或几个统计表格、圆形图、曲线图或条形图,有时还用英文或中文提纲的形式给出提示,要求我们:

  1)用文字描述图表,客观解释图表中所传递的信息,并找出某种规律或趋势;

  2)就图表中所反映的某种趋势或问题分析其原因或后果。

  图表作文着重说明事实,常常是通过对图表中所反映的具体数据的说明、分析、比较,对某种事物或现象的事实或变化情况等加以说明,并提出结论或看法。因此,图表作文常常采用议论文体的写作方法。

  写好图表作文,关键在于能否读懂图表中所提供的信息,把握各信息间的联系,用准确流畅的语言把这一信息表达出来,并就这一信息发表自己的看法。


二、图表作文的写作步骤

  写图表作文时,要注意遵循以下步骤:

  1)认真分析图表的含义,弄清图表中所含的信息及不同信息间的关系;

  2)确定文章的主题思想,构思出文章的基本框架,筛选出能说明图表主题思想的典型数据;

  3)编列文章的提纲;

  4)根据文章的提纲,将各段的提纲内容扩展成段落,然后将各个段落组成文章,注意段与段之间的衔接与过渡;

  5)检查与修改。


三、图表作文的篇章结构

  写图表作文时,常采用三段式的陈述方式。文章的第一段往往分析图表中的数据变化反映什么问题或趋势,概述图表所揭示的信息。第二段分析造成这一问题或趋势的原因。第三段则展望未来的情况或提出解决问题的办法或建议。这一结构可以简单地表述为:

…… …… 余下全文

篇七 :20xx考研英语图表作文写作方法和模板

图表作文(一)

第一节 图表作文的类型

图表作文可分为两大类:表作文和图作文。

表作文

表格(Table)可以使大量数据系统化,便于阅读、比较。表格常由标题(Title)、表头(Boxhead)(表格的第一行)、侧目(Stub)(表格左边的第一列)和主体(Body)部分(表格的其余部分)等部分组成。如下表:

用表格表达的信息具体准确,而且表格中的各项均按一定规律排列。阅读表格时要注意找出表格中各个项目的相互关系,表格中各个项目的变化规律。例如,上面的表格中的数字说明,和19xx年相比,19xx年大学入学的人数在增加,而小学的入学人数在减少。搞清楚这些变化规律也就读懂了表格的内容。

图作文

图作文又可分为三种:圆形图作文、曲线图作文和条状图作文。

(1) 圆形图作文

圆形图(Pie chart)也称为饼状图或圆面分割图。圆形图因为比较形象和直观,各部分空间大小差别容易分辨,所以常用来表示总量和各分量之间的百分比关系。整个圆表示总量,楔形块表示分量。有时圆形图还有数值表,两者结合可把各分量表示得更准确、清楚。例如: This is a pie chart of the average weekly expenditure of a family in Great Britain. As can be see from the chart, the main expenditure of an average British family is spent on food, which accounts for 25% of its total expenditure. The next two significant expending items are transport and housing, which are 15% and 12% respectively. If we take into account clothing and footwear, which makes up 10%, the four essentials of life, that is, food, transport, housing, and clothing and footwear, amount to 62% of the total expenditure.

…… …… 余下全文

篇八 :英语图表图画类作文课后作业及范文

图表图画类作文课后作业及范文

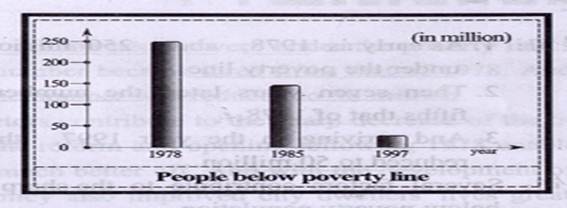
一、For this part, you are allowed thirty minutes to write a composition on the topic People below Poverty Line.
1、下图所示为1978年,1985年1997年中国贫困线以下人口的变化情况,请先描述其变化。
       2、请说明发生这些变化的原因(可从改革开放、高科技在生产中的应用等)
  3、你认为解决目前中国贫困人口还有什么困难或者问题。

      As the bar chart shows, there is a tremendous decline in the number of people below poverty line in China during the years of 1978 to 1997. As early as 1978, the number of people below poverty line in China is nearly 250 million. Then great changes have taken place due to the policy of reform and opening. Eight years later, the number had been strikingly reduced to less than 150 million. From then now, the society has also undergone a major transformation. Arriving in the year 1997, the number incredibly dropped to about 25 million.

…… …… 余下全文