篇一 :德语写作图表描述

图表描述

德福写作部分常见的配图作文有:

第一种是表格式图表(Balkendiagramm), 横竖格中的数据表示某种或几种事物发展的状况。看

这种图要注意表格的标题和项目分类,观察各个项目之间的内在关系,对图表中所反映出的数

据,趋势或问题进行对比分析,找出和归纳产生的原因,推测出未来的发展。

第二种是数字曲线图(Kurvendiagramm),图中的曲线形象地表示某些事物的状况及发展进程。

看这种图要注意曲线的上下起伏变化,注意年份和对应的增量关系。

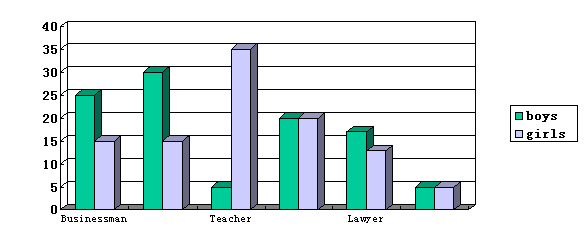
第三种是蛋糕式图表(Tortendiagramm),这种图是由一个圆形和圆内几个扇形组成。各个扇

形的比例代表了相应部分在总量中所占的分额。此表反映了总量和分量,分量和分量的相对比

例关系。

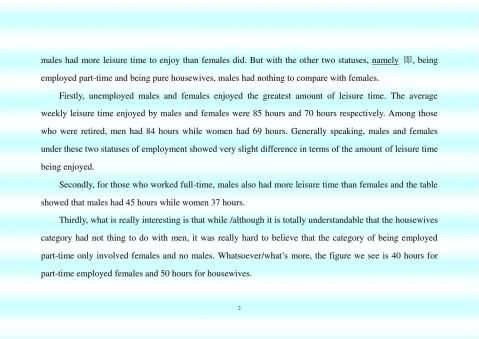
第四种是柱子型图(Sulendiagramm),柱子与柱子之间的数据或百分比表示某种事物发展趋势

或者几种事物的比较。

第五种是流程图(Skizze)这种形式表示某些事物之间的因果关系,如温室效应,酸雨,臭氧

层空洞等如何产生,某一生产或实验流程。

第六种是组合图(Synthesediagramm),组合图表有多种形式;如饼状型和柱子型、曲线型和

柱子型等。对这种图表的描述要掌握好整体和分图之间的关系。此特点是对其一图表的概括性

描写转切过渡到另一图表的具体描述。

以上六种配图作文的共同点是:要求考生把非文字的信息转化成内容连贯的文字形式,以 文字形式来描写某些事物的状况以及它们的发展变化(上升或下降),归纳重点信息,比较数

据,分析事物产生发展的原因和结果。

I. Reihenfolge der Beschreibung

1. Einleitung:引论、导入:Thema(allgemeine Informationen, keine Details)

Erscheinungsjahr /Quelle / Thema der Graphik

…… …… 余下全文

篇二 :德福作文模板

德福作文模板


Einleitung(3句)

Überleitung zur Grafik(1—2句)

Grafik beschreiben(9—10句)

Überleitung zur Stellungnahme(1—2句)

Fremdmeinung umschreiben

Meinungen abwägen

Schluss

一、Einleitung

Ø  改写原题的Einleitung,务必杜绝语法错误。

Ø  占全文比例小,3句左右适宜,不要超过4句。

Ø  Stichwort 和句型都要稍作改变。

Ø  改写模式:现象(趋势)+ 困境 + 问题

例:Viele deutsche Hochschulen stehen vor Geldmangel.(现象) Aus diesem Grund streiten die Politiker und Erzieher über die Studiengebühren als Garantie der gleichen Bildungschancen für alle.(困境) Deshalb wird heftig diskutiert, ob die Studiengebühren in Deutschland wieder erhoben werden.(问题)

Ø  若原题Einleitung部分较短时,也可以利用原题Fremdmeinung部分来引出。

二、Überleitung zur Grafik

Ø  作为Einleitung与Grafik beschreiben之间的过渡,一两句即可。

…… …… 余下全文

篇三 :Daf Aufsatz 德福作文范文

Die Frage, ob die Studiengebühren in Deutschland wieder eingeführt werden sollen, ist zur Zeit aktuell geworden. Um eine richtige Entscheidung zu treffen, müssen alle Vor und Nachteile eingesch?tzt werden. Es ist immer sinnvoll, sich mit der Erfahrung der anderen L?nder vertraut zu machen. Nach Angaben der Zeitschrift ``Forschung und Lehre`` bleibt die Situation mit den Studiengebühren in Europa eher heterogen. In Frankreich, ?sterreich, Schweden, wie auch in Deutschland kann man das Studium gebührenfrei ``genie?en``. Es klappt aber nicht in solchen europ?ischen L?ndern wie in Belgien, Italien, in der Schweiz, Gro?britanien, oder in den Niederlanden. An der Spitze der Studiengebührenpyramide steht Gro?britanien, wo sie sich von 1900 DM bis 7000 DM variieren k?nnen. Die niedrigsten Gebühren sind in Italien, von 255 bis 765 DM und in Belgien 100 bis 1050 DM. In der Schweiz sind die Gebühren etwas h?her, aber der Unterschied ist nicht so gro?. Ein Sonderfall stellen die Niederlande dar. Die Studiengebühren sind dort einheitlich für alle und betragen überall 2160 DM.

…… …… 余下全文

篇四 :图表作文范文

图表作文范文

The following table indicates the amount of leisure time per week that males and females of various employment statuses enjoyed in 2007 in certain city. The employment statuses referred to here are grouped into five categories which are: employed full-time, part-time, unemployed, retired and housewives.

Leisure Time Per Week That Males and Females Enjoyed in 2007

Employment Employed

Statuses

Amount of

Leisure

Time Per

Week (hour) full-time male / Part-time Unemployed Retired Housewives male / female female female 40 45 / 37 85 / 70 male / female 84 / 69 50

As is indicated in the table, under the backgrounds of being employed full-time, unemployed and retired, 1

图表作文范文

In general, apart from two very special groups, males had more leisure time to enjoy than females.

…… …… 余下全文

篇五 :图表作文范文汇总

图表作文范文汇总

假如你是Li Hua,是一名国际学校的学生。你最近对200名同学(男女各半)的择业理想做了一次调查,并根据调查结果(如图所示)谈谈你的看法。


I have recently made a survey among 200 boys and girls about their future jobs.

As can be seen from the chart,what boys like to do most is to become scientists and their second choice is to become businessmen. Whilethe largest group of girls would like to be teachers. Only a few boys want to do this job.

It is interesting that the numbers of boys and girls who want to be doctors are equal. As for lawyer, more boys expect to have this job. However, there are still some students who are not clear about their future.

As for me , I would like to be a …because …

07崇文一模

某英文报纸正在开展题为“中学生课堂注意力”的专栏讨论,你校准备参加,并请你代表学校写一篇文章给该英文报纸投稿。下面的图表为你校的调查结果,请你根据所提供的信息做简要说明,并根据提示给出改善的建议。注意:图中数据为学生人数百分比。

改善注意力的建议:

注意:1.词数:不少于60。

…… …… 余下全文

篇六 :图表作文(范例)

宫老师考研英语图表作文预测及练习:第1篇

Study the following pie carefully and rite an essay in which you should

  1)describe the pie,

  2)interpret its meaning, and

  3)suggest counter-measures.

  You should write about 160—200 words neatly ANSWER SHEET 2. (20 points)

[参考范文](291 words) 爱滋病的感染途径

  As is obviously betrayed in the pie above, the main contagion (接触传染) channels among China’s HIV positive cases are drug injection (43.9%), commercial blood donors (24.1%), and sexual contact (19.8%). The statistics have indicated the reality that we are facing and have profound implication for us in terms of AIDS control and prevention. 

  The implied meaning of the pie above which demonstrates how victims were usually infected in the year of 2004 is far-reaching. In the first place, the contagion channel of drug injection should be the top on our agenda. The channel of infection ranks first in the pie above currently in our society the availability of drugs are getting easier. If enough attention is not attached to the control of drug injection, China’s HIV positive cases will rocket to an alarming figure, which is bound to threaten the stability of our society.

…… …… 余下全文

篇七 :雅思写作小作文图表范文


雅思写作小作文图表范文

  很多同学在开始看到雅思考试的小作文的时候无从下手,因为在我们国家的教育中对这方面的训练较少。不过,小作文真心有用啊!不仅在雅思考试中,更是在出国后的论文里面,毕业论文图表分析有莫有?理工科小作业图表分析有莫有?不信去问广大学姐学长啊同学们。

  今天给大家展示一篇图表范文,同学们雅思考试准备前简单熟悉一下。

  You should spend about 20 minutes on this task.

  The graph and table below give information about water use worldwide and water consumption in two different countries. Summarise the information by selecting and reporting the main features, and make comparisons where relevant. Write at least 150 words.

  The graph shows how the amount of water used worldwide changed between 1900 and 2000.

  Throughout the century, the largest quantity of water was used for agricultural Purposes, and this increased dramatically from about 500 km3 to around 3,000 km3 in the year 2000. Water used in the industrial and domestic sectors also increased, but consumption was minimal until mid-century. From 1950 onwards, industrial use grew steadily to just over 1,000 km3, while domestic use rose more slowly to only 300 km3, both far below the levels of consumption by agriculture.

…… …… 余下全文

篇八 :雅思写作小作文图表范文

雅思写作小作文图表范文

  很多同学在开始看到雅思考试的小作文的时候无从下手,因为在我们国家的教育中对这方面的训练较少。不过,小作文真心有用啊!不仅在雅思考试中,更是在出国后的论文里面,毕业论文图表分析有莫有?理工科小作业图表分析有莫有?不信去问广大学姐学长啊同学们。

  今天给大家展示一篇图表范文,同学们雅思考试准备前简单熟悉一下。

  You should spend about 20 minutes on this task.

  The graph and table below give information about water use worldwide and water consumption in two different countries. Summarise the information by selecting and reporting the main features, and make comparisons where relevant. Write at least 150 words.

  The graph shows how the amount of water used worldwide changed between 1900 and 2000.

  Throughout the century, the largest quantity of water was used for agricultural Purposes, and this increased dramatically from about 500 km3 to around 3,000 km3 in the year 2000. Water used in the industrial and domestic sectors also increased, but consumption was minimal until mid-century. From 1950 onwards, industrial use grew steadily to just over 1,000 km3, while domestic use rose more slowly to only 300 km3, both far below the levels of consumption by agriculture.

…… …… 余下全文